|
|
|
|
Early Warning and Early Response, by Susanne Schmeidl and Howard Adelman (eds.)
Will H. Moore
Florida State University
Ted Robert Gurr
University of Maryland
This chapter describes three empirical approaches to generating risk assessments of ethnorebellion using 1991–95 data on 264 groups surveyed in the Minorities at Risk project. The results are compared with one another and, in high risk cases, with political developments through mid-1998. The approaches are risk profiling (based on a priori specification of risk factors), theoretical modeling, and empirical modeling, the latter two based on analysis of residuals from regression analysis. We distinguish risk assessments from early warnings and forecasts. Rather than estimating precise probabilities of ethnorebellion, we offer three alternative assessments of risks of rebellion in the mid-range future. These assessments are expected to hold only if the variables identified in the risk profiles and models remain constant—which, in a changing political world, is not likely. Our assessments should be useful because they identify key variables and high risk cases that warrant monitoring. Such monitoring CAN provide early warning, thus our assessments provide a foundation for the development of early warning systems of ethnopolitical conflict.
Introduction
There has been a great deal of recent scholarly and policy interest in empirically grounded early warnings of ethnopolitical conflict and humanitarian crises. This interest is manifest in a number of conferences, planning papers and monographs, but precious few early warnings (see Gurr and Harff 1994, 1996, 1998; Gurr and Moore 1997; Davies and Gurr 1998). Early warning implies reliable forecasts of impending events. Our research is concerned not with early warnings per se but with empirically-derived risk assessments that identify situations with a high potential for future conflict. Systematic risk assessments precede and complement early warning, in three respects. First, they identify the background and intervening conditions that establish the potential for conflict and crises. Second, they focus monitoring and analytic attention on high-risk situations before they are fully developed. Third, risk assessment models provide a framework for interpreting the results of real-time monitoring (see Harff 1996, 1998).
Area experts and desk officers are mostly skeptical because they think that substantive knowledge and Verstehen are sufficient for risk assessments and early warnings. Yet these people also use criteria and rules. The difference is that their general criteria are seldom explicitly stated; indeed they may have some difficulty writing them down if asked. The empirical researcher, on the other hand, makes criteria and decision rules explicit and, typically, applies the same criteria and rules to each case. Thus, the data-based assessments in this chapter should not be treated as fundamentally distinct from so-called expert judgments. We think that explicit statement of the criteria and decision rules is a virtue (see Gurr’s comments in Duffy et al., 1995, for a similar discussion), but emphasize that the main distinction is the transparency and, thus, the replicability of the criteria and decision rules.
We should elaborate on the difference between risk assessments and forecasts. Our assessments use data on the traits and political actions of 264 politically active ethnic groups in 1990–95 to identify the likelihood of major changes in the rebellious behavior of those groups during the late 1990s. They are not predictions in the sense that is usually meant by the terms ‘forecast’ or ‘early warning.’ We also do not estimate precise probabilities of rebellion, though it is technically possible to use data-based models to do so (see Esty et al., 1998). One basic reason for avoiding the false precision of probability estimates is that our assessments are based on an assumption that the circumstances do not improve. The assessments are produced by identifying values on the relevant variables, and pertain to the mid-range future. These assessments are expected to hold only if the values of the relevant variables remain (relatively) unchanged. That is, if a given ethnopolitical group is assessed to be at high risk of future ethnorebellion based on its incentives, capacity, and opportunities for action, any decrease in the values of these variables decreases the risks of rebellion. Policy makers, responding to their own assessments of risk, often attempt to manipulate these variables, for example by reducing the incentives or opportunities for ethnorebellion. As we show below, some of the high-risk cases we identify appear to have been managed in precisely this way.
Three Approaches
We compare the results of three approaches to generating risk assessments using the Minorities at Risk data for the 1990s. We begin with a brief description of each approach and then compare the assessments along two dimensions. First, we compare the assessments themselves: Which groups are identified as being at risk and which groups are identified as not at risk? The risk profile approach is used as a baseline against which the results of theoretical regression modelling and empirical regression modelling are compared. Second, we compare all three assessments against actual developments in 19 high-risk cases in 1997–98.
Risk Profiles:
This approach identifies a list of factors associated with high risks of ethnorebellion, analogous to the procedure used in preventive medicine to identify people at high risk of heart disease or cancer. The risk factors are based on a general theoretical model of ethnopolitical conflict and the results of empirical research using the Minorities at Risk data from the 1980s and early 1990s. The model includes three general factors, each of them operationalized using current data on 264 groups. The factors and operational measures are summarized in Table 1.
Table 1: Risk Factors in a Model of Ethnopolitical Rebellion
|
||||||||||||||||||||||||||||||||||||||
Group Incentives for Collective Action: An ethnopolitical group’s incentives for action are high to the extent its members are disadvantaged vis-à-vis other groups with whom they interact. The greater the group’s disadvantages, and the greater its members’ resentment about historical loss of autonomy and experience of repression, the greater the potential for its leaders to initiate and to persist in collective action. Four indicators are used for the analysis reported here: measures of active political, economic, and cultural discrimination in 1994–95 and an index of lost political autonomy that takes into account both the extent of autonomy lost and how recently the loss was incurred.
Group Capacity for Collective Action: The greater the sense of shared identity in a collectivity, the greater its potential for joint action in pursuit of collective interests. Identity alone is not sufficient: expression of that identity requires organization. The two indicators used to tap group capacity are strength of group identity (based on extent of cultural differentials vis-à-vis other groups) and the extent of militant mobilization, using coded information on the number and scope of militant (illegal) parties and movements active on behalf of the group in 1995.
Group Opportunities for Collective Action: Group leaders make strategic decisions about when to initiate, escalate, and terminate collective action in the context of changing political environments that shape the chances of successful rebellion. Two indicators are used. Major changes in the structure of the political regime are assumed to provide a window of opportunity; their recency is indexed using Polity III data on the timing of major, abrupt regime changes (Jaggers and Gurr 1995). Second is an indicator based on the extent to which each ethnopolitical group has symbolic and material support from kindred groups in neighboring states.
Theoretical Regression Model:
In this approach a theoretical argument is expressed in the form of a multiple equation model, analogous to the models used for economic forecasting. A statistical technique called three-stage least squares is applied to data on ethnopolitical groups to estimate the parameters of a predictive equation for ethnorebellion. Gurr and Moore (1997) applied this approach to 1980s data from the Minorities at Risk project and used the results to identify groups at high risk of rebellion in the early 1990s. The variables in the theoretical explanation of ethnopolitical conflict are identified in Figure 1.
[Figure 1 is currently unavailable]
In brief, the theory claims that ethnopolitical rebellion is directly driven by the extent of group grievances, mobilization, democratic power, and rebellion in neighboring countries. Mobilization is, in turn, a function of the group’s coherence, state repression, and grievances. Grievances are caused by political discrimination, economic discrimination, demographic stress, lost political autonomy, and past state repression. Finally, state repression is a function of democracy and the success of past repression directed at the group. 1
As in all statistical analyses, the theoretical regression model explains some case better than others. Cases not explained well by the theory are known as outliers. There are two broad classes of outliers: those with higher levels of ethnorebellion in 1991–95 than predicted by the statistical model and those with lower than predicted ethnorebellion. In this study, as in our previous one (Gurr and Moore 1997), we are especially interested in the latter: they engaged in little or no rebellion but had relatively high values on the variables identified as relevant in the model. Therefore, we assess them as being at high risk of future rebellion, provided the values of grievances, mobilization, democratic power, and regional rebellion remain the same or increase. 2 If, however, authorities in the countries in which these groups live grant political concessions that alleviate their grievances, or use repression to restrict mobilization, or if rebellions in nearby states de-escalate, we infer a lowered risk of future ethnorebellion.
Empirical Regression Model:
We also use a different regression approach, but rather than specify theoretically the variables used, we allow the statistical software package to determine what variables enter the analysis. It is, in other words, an inductive approach very similar to that used in the State Failure project, a data-based study initiated by the Clinton Administration that seeks to identify the conditions which make states vulnerable to severe political crises (Esty et al., 1997).
We began by examining Pearson correlations between the magnitude of 1990–95 ethnopolitical rebellion and a large number of indicators in the Minorities at Risk database. These include the theoretically specified indicators of group discrimination, past repression, and mobilization cited above and many others as well. We selected all variables that correlated .15 or higher with rebellion and entered them in what is called a stepwise regression—a statistical technique that builds a “best-fit model” by keeping variables that increase the accuracy with which the regression equation predicts (accounts for the variance in) ethnorebellion scores. This is a data-driven exercise in which the statistical program retains independent variables as long as they improve “the fit of the model” while others are discarded.
Not surprisingly, the empirical model identifies a different set of relevant variables than either the risk profile approach or the theoretical modelling approach. They are: state repression, extent of international military support, presence of an organization representing the group that used coercive tactics, the scope of militant organizations, lost political autonomy, whether military support was provided by kin, whether political support was provided by kin, and whether political support was provided by foreign governments. 3 The groups that are “at risk” are identified using the same outlier technique employed in the theoretical modelling approach: the high-risk cases are assumed to be the negative outliers, that is, groups that were expected to have relatively high ethnopolitical rebellion scores in 1991–95 but did not.
The empirical regression approach captures the dynamics of protracted communal rebellion. That is, almost all its variables are highest in the most severe ethnorebellions of 1990–95, therefore it is likely to generate risk assessments which imply the short-term persistence of ongoing rebellions. The theoretical model, by contrast, includes the effects of a number of background and intervening variables, and therefore is more likely to identify groups with a potential for future rebellion.
Comparing Assessments of High Risk Groups
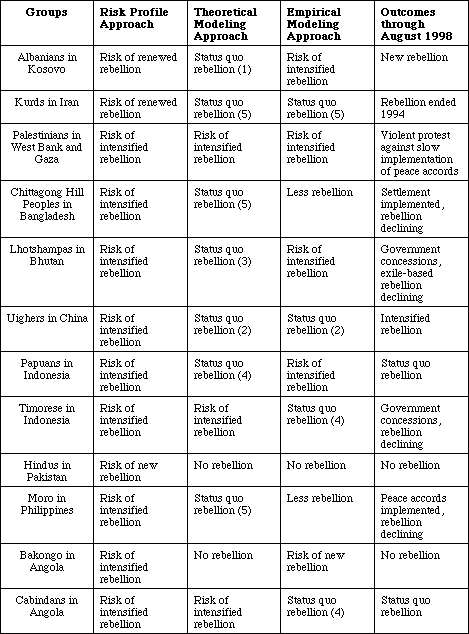
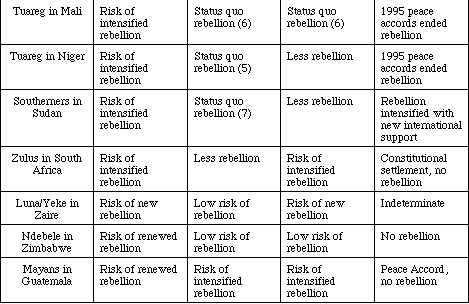
Our comparison of risk assessments begins with the results of risk profiles (Gurr and Harff 1996, Gurr 1998) that are summarized in the first column of Table 2. These studies identify 19 groups at high risk of initiating or intensifying a rebellion between 1996 and 2000. The second and third column show the risks, for these groups only, determined by the theoretical regression approach and the empirical regression approaches, respectively. The last column shows the outcomes as of summer 1998 (i.e., it summarizes the trends in ethnorebellion for the 19 groups during the first 30 months after data collection was completed).
Table 2: Risk Assessments of Ethnorebellion in the Late 1990s
|
| Note: For sources of the risk assessments, see text. “Status quo rebellion” indicates that the residual in regression analysis is within one standard deviation of the observed level of rebellion in 1991–95. The number in parentheses is the observed level in that period on a 0 to 7 scale that ranges from 1 (political banditry, sporadic terrorism) through 4 (small-scale guerrilla activity) to 7 (protracted civil war). |
We should preface a comparison of the assessments by pointing out some commonalities and differences among the approaches used. Regarding commonalities, there should be at least some similarity in results because all are based on observations and coded data from the Minorities at Risk project. If there is bias or error in the information used for some of the 264 groups, it will have similar effects across all three modes of assessment. And, although the project aims to be comprehensive, rebellions may occur among groups that were overlooked in its global survey.
Regarding differences, substantially fewer groups are identified in the risk profile approach than the regression approaches. This is the result of a deliberate strategy, when doing risk profiles, to draw attention to a relatively small set of high-risk cases. A more fundamental difference concerns the treatment of situations in which groups were already in rebellion in 1991–95 and those which were not. The risk profile approach used in Gurr and Harff (1996) and Gurr (1998) includes both kinds of groups: the interpretation is that “high risk” groups already in rebellion are likely to continue and intensify their resistance. In the theoretical modeling approach, however, Gurr and Moore (1997) were concerned only with identifying groups that had no rebellion during the base period but were at risk of future rebellion. In future work we hope to bridge the gap between these two alternatives by providing risk assessments only for groups with rebellion scores of 3 or less on the 0-to-6 scale used.
Different sampling decisions also affect comparisons across the three studies. To illustrate, the risk profiles approach only uses 1995 rebellion scores whereas the regression analyses are based on the 1990–95 period. The upshot is that a group that was engaged in rebellion during some portion of 1990–94, but not in 1995, is coded differently across the approaches. For example, the Albanians in Kosovo have a positive rebellion score in the 1991–95 regression analyses, but since they were not engaged in open rebellion in 1995, Gurr and Harff (1996) treat them as a case of inactive rebellion. Thus, in the comparisons of Table 2, the risk profile column identifies the Albanians in Kosovo as at risk of renewed rebellion whereas the empirical regression model column identifies them as at risk of intensified rebellion. Both assessments turn out to be correct, however: a clandestine guerrilla group began a campaign of terrorism in winter 1996–97 that escalated into a major ethnic war in 1998.
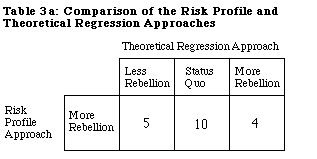
To evaluate the similarity across the three approaches we determined the extent to which the three approaches produced the same assessments. Using the data from Table 2 we assigned a value of 1 to groups that were assessed as likely to reduce their level of rebellion; a value of 2 to groups that were assessed as likely to maintain the status quo; and a value of 3 to groups that were assessed as likely to increase their level of rebellion. Since the Risk Profile approach lists all 19 groups in Table 2 as likely to increase their level of rebellion, they are each assigned a value of 3. Only the Theoretical Regression and Empirical Regression approaches produced different assessments in Table 2.
The comparisons are reported in Tables 3 and 5. Table 3a compares the Risk Profile approach against the Theoretical Regression approach. Table 3b compares the Risk Profile approach against the Empirical Regression approach (the Theoretical Regression and Empirical Regression approaches are compared across all 264 cases listed in Table 4—see Table 5). An examination of Table 2a indicates that the Risk Profile and Theoretical Regression approaches produced the same assessment in only four cases (21%): Palestinians in West Bank, Gaza; Timorese in Indonesia; Cabindans in Angola; and Mayans in Guatemala. Yet, as noted above, this outcome is driven largely by the different years used as the baseline for the assessment (1995 for the Risk Profile approach versus 1990–95 for the Theoretical Regression approach). If we take this into account and recode all ‘status quo: rebellion’ assessments in the Theoretical Regression approach column of Table 2 as 3’s, then 14 of the 19 cases (74%) are assessed the same. Only the Hindus in Pakistan; Bakongo in Angola; Zulu in South Africa; Lunda/Yeke in Zaire; and Ndebele in Zimbabwe produce different assessments. Thus, taking into consideration the use of a different base year, there is substantial similarity across the assessments produced by the Risk Profile approach and the Theoretical Regression approach.
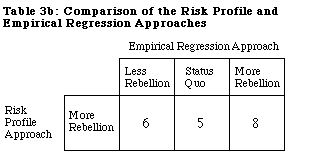
An examination of Table 3b indicates that there is greater similarity across the Risk Profile approach and the Empirical Regression approach when one ignores the issue of a different baseline year: eight of the 19 cases (42%) produce the same assessment. However, if we recode the ‘status quo: rebellion’ assessments in the Theoretical approach column of Table 2 as 3’s, then we add five more cases: 13 of the 19 cases (68%) are assessed the same. Thus, while there is still substantial similarity across the Risk Profile and Empirical Regression approaches, there is more similarity between them than there is between the Risk Profile and Theoretical Regression approaches when we ignore the base year, but slightly less similarity (in comparison with the Risk Profile and Theoretical Regression approaches) when we recode to account for the difference in the base year.
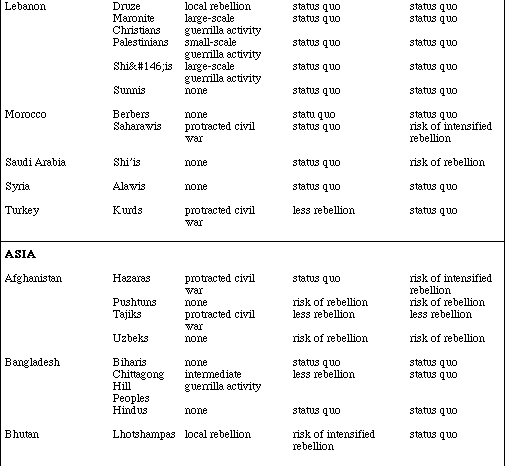
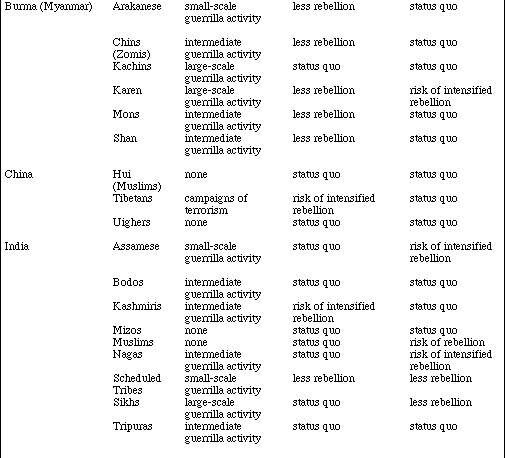
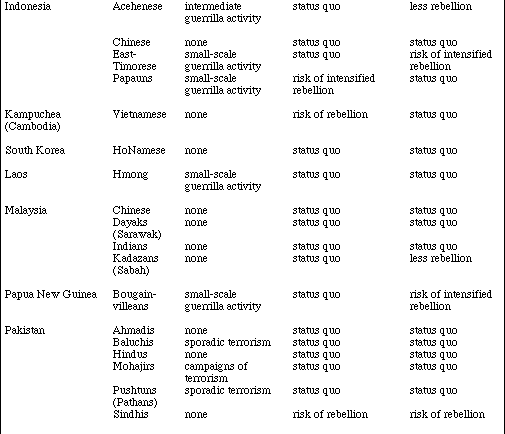
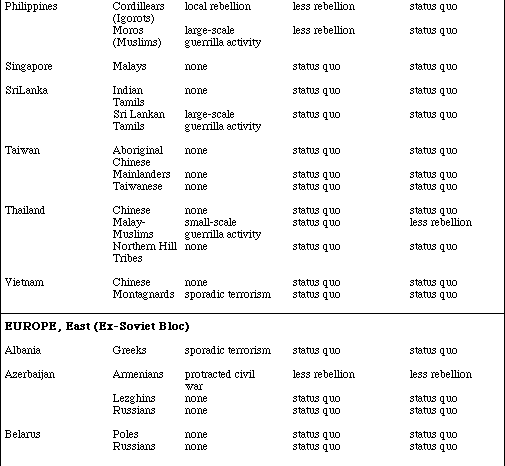
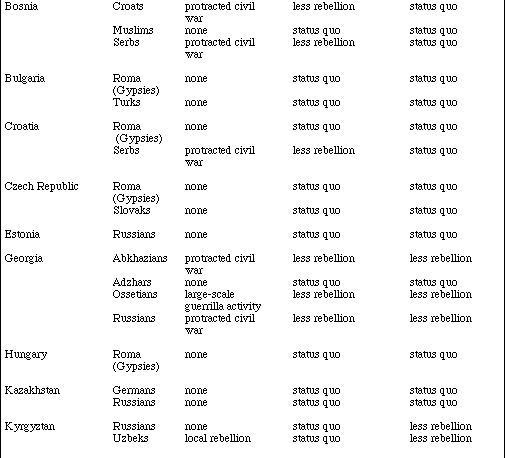
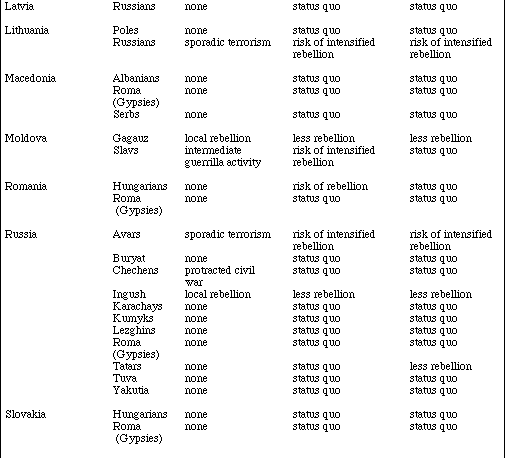
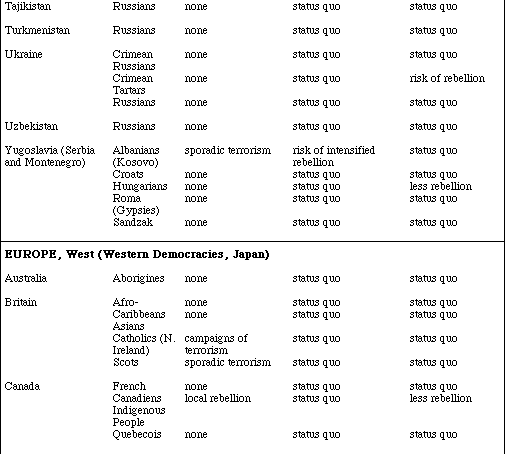
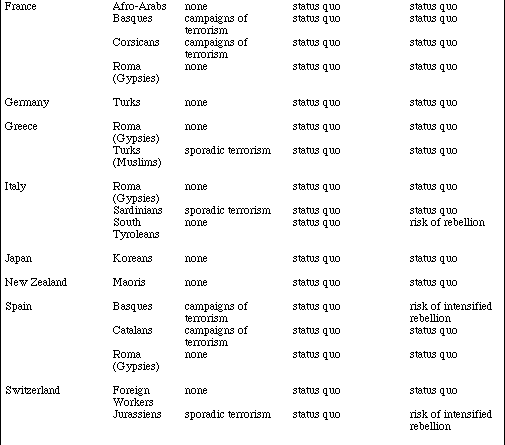
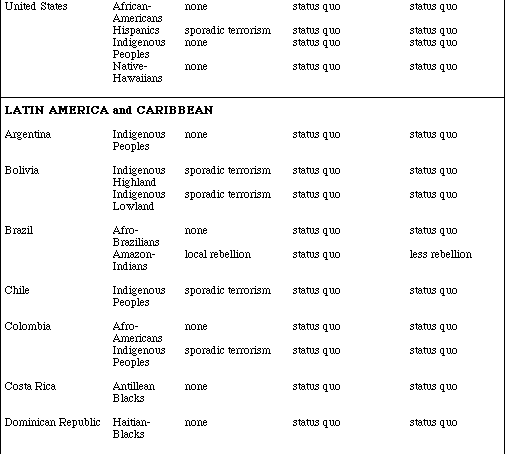
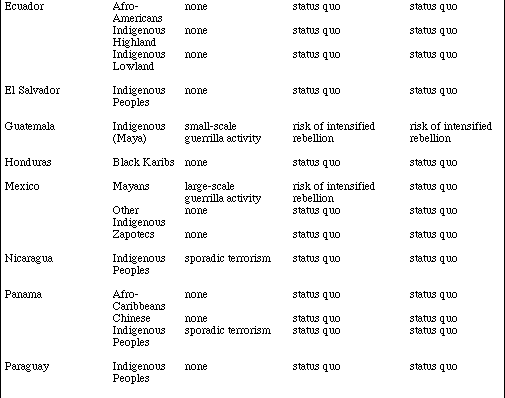
A direct comparison of the Theoretical Regression approach and the Empirical Regression approach is provided in Table 4. While the advantage of this comparison is not terribly obvious when there are only 19 groups (as in Tables 2 and 3), the utility of the comparison becomes readily apparent when trying to digest the assessments made across 264 groups! Groups assessed as likely to reduce their level of rebellion are assigned a 1; groups assessed as likely to maintain the status quo (whether that means continuing to rebel or refraining from rebellion) are assigned a 2; and groups assessed as likely to increase their level of rebellion (whether that means a new rebellion or intensification of an extant rebellion) are assigned a 3 in the comparison reported in Table 5.
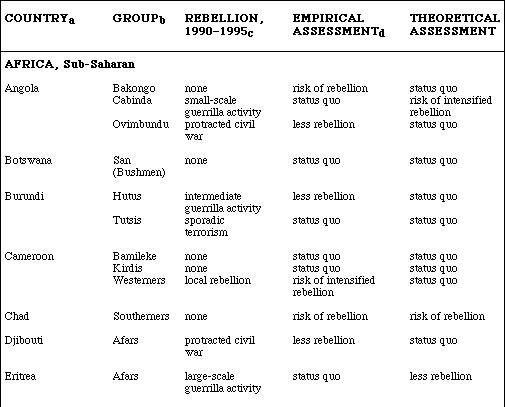
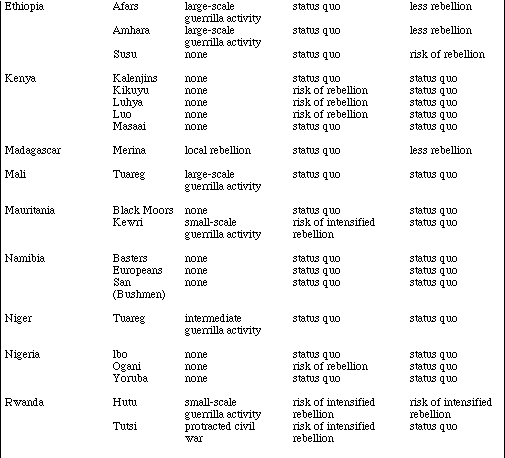
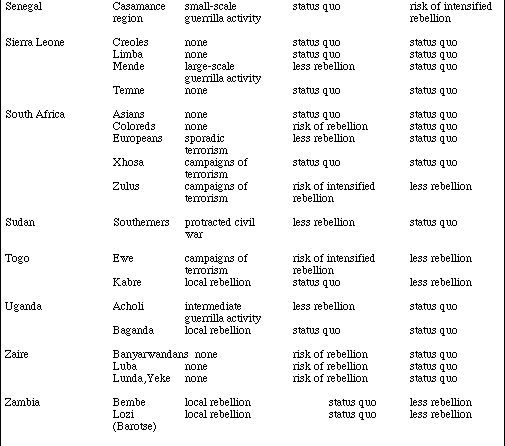
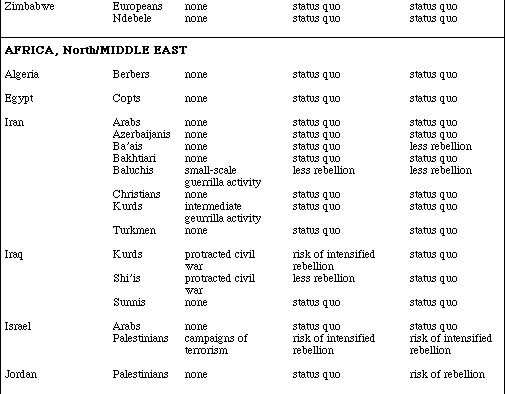
Table 4: Risk Assessments of Ethnopolitical Rebellion:
Regression Approaches

|
|
NOTES:
a The countries are sorted alphabetically by region. b The groups are sorted alphabetically by country. c Highest level exhibited during 1990–1995. d Scores are based on the error term from the regression analysis. Errors that are greater than -1 standard deviation from the mean error score are ‘at risk’ to rebellion (if there was no rebellion in 1990–95) or intensified rebellion (if there was rebellion in 1990–95). Errors between -1 standard deviation and +1 standard deviation are marked as status quo—they are assessed as likely to continue in their present state. Finally, errors greater than +1 standard deviation are marked ‘less rebellion’ indicating that these groups may be amenable to cease fires, but are assessed to be likely to decrease their level of rebellion. |
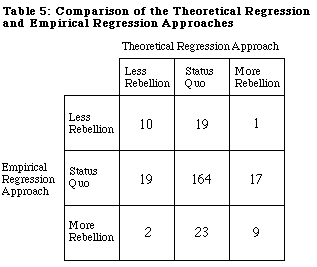
In addition to examining Table 4, a brief look at the distribution of groups across the three assessments is useful. The Theoretical Regression approach identified 30 groups as likely to reduce their level of rebellion whereas the Empirical Regression approach produces 31 (please see Table 4 to identify the groups). Thus, both approaches produce roughly the same number of groups assessed as likely to reduce their level of rebellion. We will see that this is true across all three assessment categories. Yet, before turning to the others it is useful to note that the approaches often identify different groups: 19 of the 30 groups assessed as likely to reduce rebellion by the Theoretical Regression approach are assessed as status quo by the Empirical Regression approach, and one is assessed as likely to increase rebellion; similarly 19 of the 31 groups assessed as likely to reduce rebellion by the Empirical Regression approach are assessed as status quo by the Theoretical Regression approach, and two are assessed as likely to increase rebellion. Thus, the approaches are assessing similar numbers of groups at risk, but not the same ones. That the approaches identify similar numbers of groups in each category is not surprising given how we have produced these assessments: using the errors from regressions.
In addition, the Theoretical Regression approach assesses five groups (out of 30; 17%) that did not engage in rebellion during 1990–95 as likely to reduce their level of rebellion. The Empirical Regression approach only assessed groups that were actively engaged in rebellion during 1990–95 as likely to reduce their level of rebellion. One reasonable criterion for risk assessment is that it should not produce assessments that are nonsensical, and the five cases of reduced rebellion produced by the Theoretical Regression approach fail to meet that criterion. The five are the Ba’hais in Iran, Kadazans in Malaysia, Russians in Kyrgyztan, Tatars in Russia, and Hungarians in Serbia. However, with the possible exception of Russian Tatars, all these groups have strong disincentives for rebellion. Kadazans pursue their interests within a quasidemocratic political system, Russians can continue to leave Kyrgyztan, and Ba’hais and Hungarians are at risk of severe repression for any kind of resistance to state policies. One should also consider a methodological explanation for this outcome: ordinary least squares and three stage least squares regression analysis performs best when the data being analyzed can vary between -infinity and +infinity, yet our data (i.e., Rebellion, 1990–95) can only take values between zero and seven. Regression analysis generally produces expected values that below zero, and the six cases noted above each had an expected value below zero and a score of zero, which is why they are assessed as expecting less rebellion. King (1988) describes a poisson regression procedure for estimating data that cannot take values below zero, but we are not aware of extensions of this procedure that can be used to estimate systems of equations, such as three stage least squares. Since our theoretical approach specifies a system of equations, we have selected so use three stage least squares rather than poisson regression. Each approach has a drawback given the combination of our theoretical argument and the values our data can take.
The Theoretical Regression approach produces 200 ‘status quo’ assessments (which include both groups that are engaged in rebellion and groups that have not engaged in rebellion) and the Empirical Regression approach produces 206 ‘status quo’ assessments. Finally, the Theoretical Regression approach produces 34 ‘at risk of rebellion’ assessments and the Empirical Regression approach produces 27 ‘at risk of rebellion’ assessments. Turning to the question of the similarity across the two approaches, 183 of the 264 cases (69%) produced the same assessments (these cases make-up the northwest to southeast diagonal in Table 5). Further, of the 81 groups with divergent assessments (i.e., all those that are off the northwest to southeast diagonal in Table 5), only 3 of the 264 cases (1%) are groups where one approach assessed the group as likely to decrease its level of rebellion and the other approach assessed the group as at risk of rebellion. Pearson’s chi-square is a statistic that can be used to test whether the observed distribution of cases along the northwest to southeast diagonal as opposed to those off of the diagonal, in a contingency table, is a chance association. The Pearson’s chi-square for Table 5 is 26.2 (with 4 degrees of freedom), and that score allows us to reject the null-hypothesis of no relationship between these two approaches with 99% confidence. Of course, we are not interested in determining whether the approaches are causally related—which is the conventional use of the chi-square statistic—but simply whether there is substantial similarity across the assessments. The contingency table analysis confirms the similarity.
In sum, then, the three approaches produce distinct assessments of risk of rebellion among the world’s ethnopolitical groups, but there is sufficient similarity to suggest that the assessments are far from random: distinct criteria (i.e., variables) and decision rules produce distinct, but roughly similar assessments when applied to the Minorities at Risk data. Whether the assessments produced by one of the approaches is better than another is a separate question and, we contend, one that is more difficult to address than first meets the eye.
Should we Choose among Approaches?
What advantages are to be gained by using one approach as compared with the others? At this juncture we contend that it is difficult to select one over the others. As Gupta (1997) explains, there is enormous debate among econometric forecasters about the different possible measures available for assessing the utility of a set of forecasts against the observed outcomes. Thus, an appeal to evaluating these approaches for producing assessments against the (eventual) observed record is not as straight forward as one might believe. Further, if one wishes to use observed outcomes as a benchmark, one must take into account not only the assessment (i.e., the expected value of ethnorebellion), but also the observed values on the other variables specified by each approach for, as we argue above, the assessments are based on the assumption that the values of these variables do not change. We know that they often do, and that is part of why we emphasize the importance of developing assessments as a basis for early warning.
Comparing Risk Assessments with Outcomes
All three approaches use information from the first half of the 1990s, and in no case later than December 1995, to make risk assessments for the second half of the decade. Thirty months have already elapsed. The last column of table 2 sketches the changes that have occurred in each high-risk group identitied in the risk profile approach. The results are intriguing. Two high-risk groups have in fact initiated new campaigns of armed violence in these 30 months: the Kosovar Albanians and the Uighers in China’s Xinjiang province. In seven other instances ongoing rebellions have declined following negotiated settlements or concessions. Armed opposition has largely or entirely ended among the Chittagong Hill peoples in Bangladesh, Moros in the Phillippines, East Timorese in Indonesia, Tuaregs in Mali and Niger, Zulus in South Africa, and indigenous peoples in Guatemala. This suggests that governments in these countries were well aware of the risks of escalating rebellion and took some mix of corrective and coercive actions that, in the short run, have dampened rebellions. But this does not mean that risks have necessarily been reduced! Failure to carry through on negotiated settlements is likely to lead to renewed resistance, as it has among some Palestinians. In two other cases—the Lhotshampas in Bhutan and Ndebele in Zimbabwe—governments have modified their policies toward minorities in ways that appear to have defused potential resistance. In short, in almost all the high risk cases, a shift toward more coercive government policies or the opening up of political opportunities probably would trigger new rebellions. In only one of the 19 cases is an ethnorebellion intrinsically implausible: the Hindus in Pakistan. Unlike all other groups in Table 2, they are a dispersed minority and thus probably incapable of organized resistance. One possible implication of this observation is that the physical concentration or dispersion of a group should also be included in the variables used for risk assessments.
Gupta (1998) concludes his chapter with the advice to forecast early and often. We might quip ‘let a field of assessments bloom.’ The potential downside to this strategy obtains if too many cases are assessed at risk by different approaches: monitoring resources are scarce and policy-makers’ attention spans are limited. If there are too many “false positives” then the assessments may be too easily discounted. However, the results of this chapter suggest that, while the three approaches identify somewhat different high-risk groups, there is a great deal of overlap. Further, one might decide to concentrate analytic attention on cases that show up on several (or all) assessment lists.
The main point is that assessments can be used to identify cases that should be closely monitored. Moreover, our approaches each identify variables that need to be monitored (and the Minorities at Risk project provides a set of procedures for doing so). Monitoring thus can produce early warnings by looking for and highlighting evidence of shifts in variables that increase risks of ethnorebellion (or, for that matter, that reduce risks of ethnorebellion). We prefer the theoretical approaches offered by the Risk Profile and Theoretical Regression approaches to the inductive Empirical Regression approach, but we also see virtue in a multi-approach (and, thus, multi-assessment) strategy. Thus we think it would be a mistake to be overly concerned with determining which approach produces the ‘most accurate’ assessments. It is more important to monitor high risk cases and to make a long-term effort to compare assessments with outcomes.
Conclusion
This chapter presents and compares the risk assessments produced by three different approaches using the Minorities at Risk data. The main contentions in the chapter are:
References
Davies, John and Ted Robert Gurr (Eds.). 1998. Preventive Measures: Building Risk Assessment and Crisis Early Warning Systems. Totowa, NJ: Rowman and Littlefield.
Duffy, Gavan, Ted Robert Gurr, Philip A. Schrodt, Gottfried Mayer-Kreiss, and Peter Brecke. 1995. “An Early Warning System for the United Nations: Internet or Not?” Mershon International Studies Review, 39:315–326.
Esty, Daniel C, Jack A. Goldstone, Ted Robert Gurr, Barbara Harff, Pamela T. Surko, and Alan N. Unger. 1998. “The State Failure Project: Early Warning Research for US Foreign Policy Planning.” In Davies and Gurr, eds., 1998.
Gupta, Dipak K. 1998. “An Early Warning about Forecasts: Oracle to Academics,” in Susanne Schmeidl and Howard Adelman (eds.) Early Warning and Early Response. Columbia International Affairs Online, Columbia University Press.
Gurr, Ted Robert. 1993. Minorities at Risk: A Global View of Ethnopolitical Conflict, Washington, DC: United States Institute of Peace Press.
Gurr, Ted Robert. 1998. “A Risk Assessment Model of Ethnopolitical Rebellion.” In Davies and Gurr 1998.
Gurr, Ted Robert. Forthcoming. Peoples versus States: Ethnopolitical Conflict and Accommodation at the End of the 20th Century. Washington, D.C.: United States Institute of Peace Press.
Gurr, Ted Robert and Michael Haxton. 1996. Minorities at Risk Phase III Dataset User’s Manual, College Park: Center for International Development and Conflict Management, University of Maryland.
Gurr, Ted Robert and Barbara Harff. 1994. “Conceptual, Research and Policy Issues in Early Warning Research: An Overview.” Journal of Ethno-Development, special issue on Early Warning of Communal Conflicts and Humanitarian Crises, vol. 4 (July), pp. 3–14.
Gurr, Ted Robert and Barbara Harff. 1996. Early Warning of Communal Conflicts and Genocide: Linking Empirical Research to International Responses, Tokyo: United Nations University Press, Monograph Series on Governance and Conflict Resolution.
Gurr, Ted Robert and Will H. Moore. 1997. “Ethnopolitical Rebellion: A Cross-Sectional Analysis of the 1980s with Risk Assessments for the 1990s,” American Journal of Political Science, 41(4):1079–1103.
Harff, Barbara. 1996. “Early Warning of Potential Genocide: The Cases of Rwanda, Burundi, Bosnia, and Abkhazia,” pp. 47–78 in Gurr and Harff (1996).
Harff, Barbara. 1998. “Early Warning of Humanitarian Crises: Sequential Models and the Role of Accelerators.” In Davies and Gurr, eds., 1998.
Harff, Barbara, and Ted Robert Gurr. 1998. “Systematic Early Warning of Humanitarian Emergencies.” Journal of Peace Research 35(4).
Jaggers, Keith and Ted Robert Gurr. 1995. “Tracking Democracy’s Third Wave with the Polity III Data,” Journal of Peace Research, 32:469–482.
King, Gary. 1988. “Statistical Models for Political Science Event Counts: Bias in Conventional Procedures and Evidence for the Exponential Poisson Regression Model,” American Journal of Political Science, 32:838–863.
Endotes
*:
Note: Revision of a paper prepared for presentation at the Synergy in Early Warning Conference, York University, Ontario 15–18 March, 1997 and the International Studies Association Annual Meeting, Toronto, 18–22 March, 1997.
The authors contributed equally to designing this study. Michael Haxton, formerly minority project coordinator, prepared the dataset used in this paper but his contribution to the analysis and write-up of the research report was limited by the birth of his son, Connor Reed Haxton, which we all agreed took precedence. Moore is listed first because—once the study is published—the marginal impact on Gurr’s SSCI count will be negligible. We would like to acknowledge the support of the National Science Foundation (SBR-9321862), the United State Institute of Peace (USIP-044-93F), The Korea Foundation, and the Center for International Development and Conflict Management at the University of Maryland, College Park. Anne Pitsch and Deepa Khosla of CIDCM provided updates of conflict profiles for the high-risk cases listed in Table 1. Back.
Note 1: The theoretical regression risk assessments are actually produced using a revised and more nuanced theoretical model than the one described above and in Gurr and Moore (1997). The revised theoretical model is similar and is detailed in Gurr (forthcoming), chap. 3. Back.
Note 2: To be more specific, we calculated the mean and standard deviation of the errors from the ethnorebellion equation. The groups that produced an error score less than one standard deviation below the mean were assessed at high risk to engage in ethnorebellion (if they had not been active during 1990–95) or at high risk to renew or intensify their rebellion (if they were engaged in rebellion during 1990–95). The selection of one standard deviation below the mean is admittedly arbitrary but impresses us as a reasonable choice. The system of equations was estimated with a three stage least squares estimator (using the 3sls command in Shazam, version 7.0 for Unix). Back.
Note 3: The variables that were selected by the stepwise regression technique are what we call protracted rebellion factors. That is, they are especially strong explanatory variables for explaining variance in data sets where cases of protracted rebellion account for a substantial portion of the variance in the dependent variable. Our measure of ethnorebellion is just such a variable. In future work we intend to reconstruct our measure of ethnorebellion in an effort to separate the cases of protracted ethnorebellion from those of new or recent cases of ethnorebellion. Doing so is important not only for constructing and testing theoretical models of ethnopolitical conflict, but especially for risk assessments as we are interested in assessing not the risk of becoming a protracted ethnorebellion, but rather a new or intensified ethnorebellion. This weakness of our ethnorebellion measure affects both of the regression approaches described in this paper, but especially the Empirical Regression approach. Back.