|
|
|
|
Early Warning and Early Response, by Susanne Schmeidl and Howard Adelman (eds.)
Deborah J. Gerner and Philip A. Schrodt
Department of Political Science, University of Kansas
Abstract
The international news media have a tremendous impact on the prediction and assessment of humanitarian crises. While government agencies, IGOs and NGOs have internal sources of information about areas experiencing stress, academic researchers and the general public—whose interests often must be mobilized to support intervention—are likely to depend primarily on electronic sources such as CNN, Reuters, Agence France Press and elite newspapers such as The New York Times. It is well known that the coverage provided by these sources is uneven, particularly in marginal areas such as Africa and Central Asia, and that their attention-span is limited. In this chapter we examine some characteristics of media coverage of a well-covered region—the Arab–Israeli conflict—and assess systematically how this coverage might affect early warning and monitoring.
We first examine the issue of “media fatigue”: how does the number and type of events reported in public sources change as a conflict evolves? Using the first three years of the Palestinian intifada as a case study, we compare the reports of uses of force in event data sets based on Reuters and on the New York Times with reports in an independently-collected data set from a human rights data center. As predicted by the media fatigue hypothesis, we find that the correlation between the three sources declines over time. The correlation between Reuters and The New York Times changes in a pattern that is similar to the correlation between these sources and the human rights data source, suggesting that the correlation between the two news sources could be used as an indicator of the bias in an event data set caused by media fatigue.
Second, we analyze with the effects of various levels of event data aggregation on a cluster-based early warning indicator for political change in the Levant. Our results show that very high levels of aggregation—for example distinguishing only between conflict and cooperation, or simply counting the number of events—provide almost as much predictive power as that provided by more detailed differentiation of events. At an extreme level of aggregation, we find that a data set that indicates only whether any events were reported for a dyad provides about 50% of the clustering of political activities that is provided by detailed coding.
These findings have two implications. First, the limitations of media fatigue in newswire and newspaper sources suggest that early warning models might benefit from greater attention to specialized reports such as those available through ReliefWeb; this is particularly important in long-term monitoring. Second, much of the variance provided by media reports such as Reuters and The New York Times is found in the existence of the reports—whether a region is being covered at all—rather than in the detailed content of those reports. Because of this limitation, complex coding schemes requiring expert interpretation of news reports are unlikely to provide significantly more information than simpler coding schemes such as those that can be implemented with all-machine coding.
Introduction
This chapter presents a technical analysis of two factors that can affect early warning systems that use publicly-available news sources for early warning: media fatigue and event-aggregation effects. The international news media have a tremendous impact on the prediction and assessment of humanitarian crises. While government agencies, IGOs and NGOs have internal sources of information about areas experiencing stress, academic researchers and the general public—whose interests often must be mobilized to support intervention—are likely to depend primarily on electronic sources such as CNN, Reuters, Agence France Press and elite newspapers such as The New York Times. It is well known that the coverage provided by these sources is uneven, particularly in marginal areas such as Africa and Central Asia, and that their attention-span is limited. In this chapter we examine some characteristics of media coverage of a well-covered region—the Arab–Israeli conflict—and assess systematically how this coverage might affect early warning and monitoring.
We first examine the issue of “media fatigue”: how does the number and type of events reported in public sources change as a conflict evolves? Using the first three years of the Palestinian intifada as a case study, we compare the reports of uses of force in event data sets based on Reuters and on the New York Times with reports in an independently-collected data set from a human rights data center. As predicted by the media fatigue hypothesis, we find that the correlation between the three sources declines over time. The correlation between Reuters and The New York Times changes in a pattern that is similar to the correlation between these sources and the human rights data source, suggesting that the correlation between the two news sources could be used as an indicator of the bias in an event data set caused by media fatigue.
Second, we analyze with the effects of various levels of event data aggregation on a cluster-based early warning indicator for political change in the Levant. Our results show that very general levels of aggregation—for example distinguishing only between conflict and cooperation, or simply counting the number of events—provide almost as much predictive power as is provided by more detailed differentiation. At an extreme level of aggregation, we find that a data set that indicates only whether any events were reported for a dyad provides about 50% of the clustering of political activities that is provided by detailed coding.
Media Fatigue in Coverage of the Palestinian Intifada
The issue of media bias has long been a concern in event data analysis (Azar, Brody & McClelland 1972, Burgess &Lawton 1972, Azar &Ben-Dak 1975, Laurence 1990, Merritt, Zinnes &Muncaster 1994) . For instance, an early study by Doran, Pendley, &Antunes (1973) found that when measuring the level of domestic conflict in Latin America, regional sources produced dramatically different results than simply coding The New York Times. The issue we address here is somewhat different: the effects that occur over time, in a single source, in the coverage of a protracted conflict—the Palestinian intifada.
The “media fatigue” hypothesis suggests that the coverage of a protracted conflict may be high when hostilities first break out, then decline steadily as reporters, editors, and readers become bored with the issue. Alternatively, after an initial wave of reports, coverage of a protracted conflict may decline to a relatively constant level— regardless of the actual events on the ground—due to the allocation of reporting assets to the conflict.
A second factor that may influence the extent of media coverage is competition from other news events. For example, after visually examining the event series dealing with the intifada (Schrodt &Gerner 1994), we speculated that there was a drop-off in coverage of the intifada by The New York Times (NYT)in the summer and fall of 1989 when attention turned to the collapse of communism regimes in Eastern Europe.
Investigating media fatigue is inherently problematic because one must have an independent benchmark for what actually occurred, which in general cannot be ascertained in the absence of media coverage. (In any case, one cannot use media coverage to measure media fatigue.) In our analysis, we deal with this problem in two different ways. First, we use an independent measure of Palestinian deaths caused by Israeli military forces and their agents during the intifada collected by the Jerusalem-based Palestinian Human Rights Information Center (PHRIC 1993) and compare this with a net conflict/cooperation measure aggregated using the Goldstein (1992) scale, and with the number of World Event Interaction Survey (WEIS; McClelland 1976) Force events (WEIS categories 221, 222, and 223) coded from Reuters. Second, we compare the events generated from Reuters with the events that Tomlinson (1993) generated from NYT. We will compare these sources both graphically and in terms of statistical correlations. This allows us to see whether Reuters (which often produces reports that are not printed in the newspapers) reflects events “on the ground” more closely than does NYT.
As Table 1 shows, the overall correlations between these measures of conflict are high when the entire series is considered; all of the correlations are significant at the 0.05 level. (The Goldstein scores have been multiplied by -1 so the correlations are positive; this is our “net conflict” variable.) We would not expect the number of deaths reported by PHRIC to be identical to the number of WEIS Force events because the WEIS force category also includes some non-fatal violent encounters, and an incident resulting in multiple deaths that were counted separately by PHRIC might be reported as a single event in Reuters or NYT.
Table 1: Correlation of Variables Used to Study Media Fatigue
|
Reuters Goldstein |
NYT
Goldstein |
Reuters “Force” Events |
|
|
PHRIC Deaths |
0.643 | 0.761 | 0.630 |
|
Reuters Goldstein |
0.803 | 0.930 | |
|
NYT
Goldstein |
0.794 |
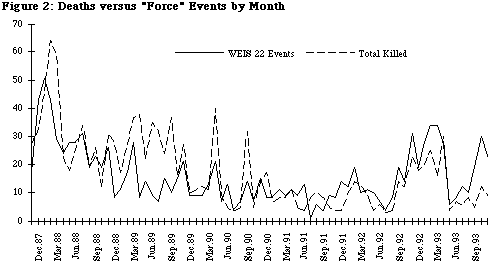
Figure 2 compares the monthly time series for the total number of deaths reported by PHRIC and the number of WEIS Force events in the Reuters event data. With the exception of a few months — most notably the summer and fall of 1989—the two series covary fairly regularly. In some cases, there are conspicuous outlying points due to incidents that generated a large number of deaths but a disproportionately small number of reports. Two such spikes are the initial deaths from the Rishon LeZion massacre in May 1990 (and additional deaths that occurred with the suppression of demonstrations following these killings) and the large number of deaths at Haram ash-Sharif and its aftermath in October 1990.
In order to explore the issue of whether this pattern has changed over time, we regressed the number of deaths on the net conflict score produced by both our data set and Tomlinson’s (1993) human-coded WEIS set based on NYT, and then looked at the residuals of this. If a residual is greater than zero, it means that the number of deaths is greater than the average being reported by Reuters and NYT; if the residual is negative, the number of deaths is lower.
These results are reported in Figure 3. As expected, the summer and fall of 1989 are conspicuous positive outliers, where deaths appear to have been under-reported. While we initially thought this problem affected NYT more than Reuters, it appears to influence both sources. Under-reporting also occurs in March and April 1988, although this is followed immediately by two months of over-reporting.
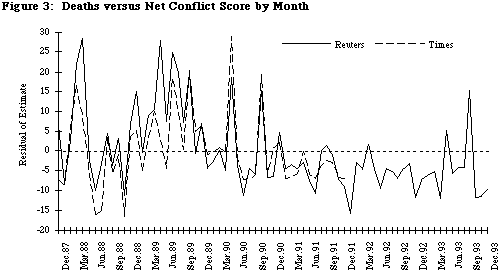
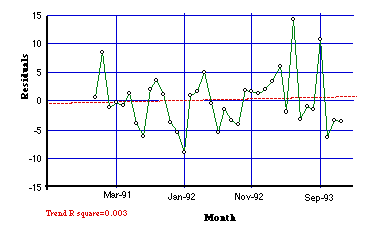
The apparent pattern of over-reporting (negative residuals) by Reuters in the second half of the series is, however, an artifact of the outlying points in the 1989 and 1990. Figure 4 shows the residuals for only the period December 1990–December 1993; the dotted line is a trend determined by regression. This trend is almost flat, so we conclude that since December 1990, the relationship between deaths and the net conflict measured by Reuters reports has not been consistently increasing or decreasing.
| Figure 4: Residual Relationship of Deaths and Net Conflict, December 1990 – December 1993 |
Somewhat to our surprise, the coverage by NYT follows the trends of Reuters very closely; early 1988, summer and spring 1989 and the two 1990 data points are the primary outliers. The NYT-based data only goes to December 1991, but by then NYT seems to have settled down to about the same constant level of reporting as Reuters. In this sense the two sources are far more similar than we anticipated.
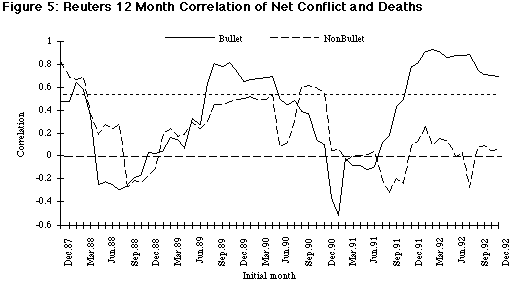
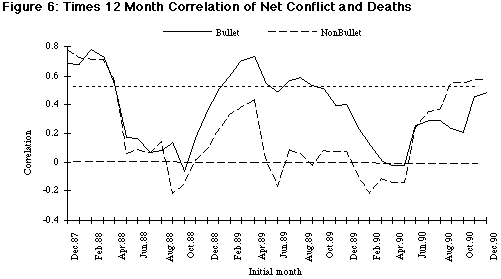
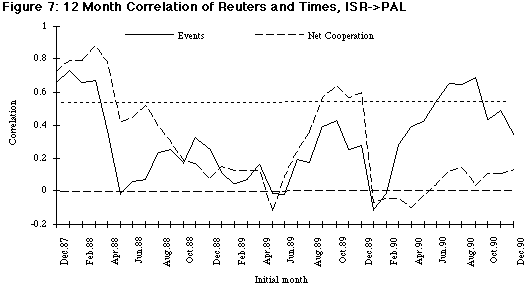
As Figure 4 shows, even when a trend is absent from the media coverage, there is still a substantial scatter in the data. While the overall correlation between the conflict variables is significant, the pattern of correlation may change over time. In other words, the media may cover some periods of time more consistently than others. To explore this issue, we computed correlations between the different sources for moving 12-month intervals. The 12 month period was chosen because the Israeli–Palestinian data show annual seasonality (Schrodt &Gerner 1994). The results of these calculations are shown in Figures 5 through 8. In each of these figures the labels on the X-axis show the initial month of the 12 months of data used to compute the correlation. For example, the point labeled “Aug-89” is the correlation of points from August 1989 through July 1990. The dotted line at r = 0.57 is the approximate 0.05 significance level.
Figures 5 and 6 show the correlation between net conflict reported by Reuters and NYT and two measures of death reported by PHRIC, bullet and non-bullet (primarily deaths from beatings and inhalation of tear gas). 2 The moving correlation shows a very different pattern than the comparisons of levels, particularly with respect to the effects of media attention on Eastern Europe. Both NYT and Reuters show a high correlation during the first 16 months of the intifada, but after this the 12-month period, the correlation drops quite dramatically for about a year in the case of Reuters and for nine months in the case of NYT. Most of these periods of low correlation include some of the months in the second half of 1989, although the drop-off in correlation begins well before that time. Beginning about January 1989 for NYT and August 1989 for Reuters, the correlation increases and stays significant for about a year in both cases, before dropping off again for almost two years. In the case of Reuters, this second decline corresponds closely to the Iraq–Kuwait crisis of 1990–1991. The drop-off occurs much earlier for NYT, and as we had speculated, the correlation is particularly low in the second half of 1989. The NYT series is increasing as the data series ends; the Reuters series reaches a highly significant and fairly steady level after the middle of 1991. The correlations for non-bullet deaths are substantially lower than those for bullet deaths but otherwise the general patterns are similar except for the post-1991 period in Reuters. (Non-bullet deaths also declined as a percentage of total deaths and relatively few non-bullet deaths occurred during the post-1991 period.)
Figures 7 and 8 show the moving correlations between the number of events and the net cooperation measure computed from Reuters and NYT for both the Israel > Palestinian and Palestinian > Israel dyads. For the first two years of the reported correlations (covering the first three years of the data), the changes in the Israel > Palestinian pattern follow much the same pattern as the Reuters correlation with PHRIC-reported deaths. After January 1990, there is a rapid drop in the correlation in terms of the net cooperation measure, although the correlation with the number of events increases near the end of the period. These final months correspond to the Iraq–Kuwait crisis and the decline in the correlation may be due to Reuters and NYT having different reporting priorities.
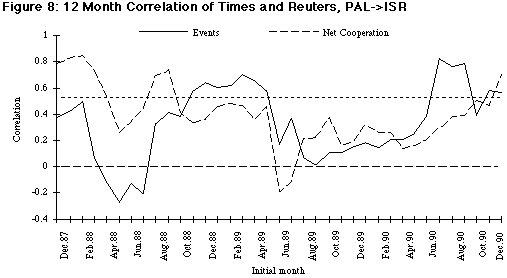
The pattern of correlation in the coverage of the Palestinians > Israel directed dyad is quite different from that of the Israel > Palestinians directed dyad. The Palestinians > Israel correlation across the entire data set is r = 0.63, as opposed to r = 0.80 for Israel > Palestinians, so the levels are generally lower. The correlation in the net cooperation measure declines much more slowly than in the Israel > Palestinians case, and does not show the increase in the months starting about August 1989. The slower decline in Palestinians > Israel may be due to what is known in journalism as the “man bites dog” effect: After several months of reporting Israeli uses of force against Palestinians (which were quite common), this phenomenon was no longer considered newsworthy, whereas Palestinian uses of force against Israelis—an activity that was relatively unusual in the early period of the intifada —continued to be newsworthy because of its novelty. The correlation at the end of the period is significant for both the number of events and net cooperation score, whereas there is almost no correlation in net cooperation in the Israel > Palestinians directed dyad.
If the patterns of coverage of the intifada can be generalized to other protracted conflicts, we can draw three general conclusions about the issue of “media fatigue.” First, all of the correlations show a short-term rise and then decline in the initial year of the intifada. This is the strongest pattern found in the analysis and it is consistent with the hypothesis that the media becomes very interested in a conflict, covers it intensely for six months to a year, and then loses interest. As attention to the intifada declined, the correlation between Reuters and NYT also declined. In other words, as coverage by the international media becomes less thorough, it also becomes less consistent. We therefore conclude that for perhaps eighteen months, media fatigue seems to operate.
The long term, however, shows quite a different pattern and two other factors appear to be relevant. First, the influence of competing stories—the Iraq–Kuwait crisis and the collapse of communism in the Soviet Union and Eastern Europe—seem to be more important than was the general fatigue pattern. These competing stories have a particularly strong impact on the correlation between the two media sources: Once again, as interest declines, so does consistency. In the absence of a competing story, however, the fatigue effect appears to end and coverage reaches a steady-state, at least in the final three years of the Reuters data.
Unfortunately, there are insufficient data to ascertain whether the same steady-state would be found in NYT data. With the exceptions already mentioned, there is a significant decline in intifada-related deaths through 1990, 1991, and the beginning of 1992. Thus, it is difficult to determine whether the steady-state level of media coverage had a high correlation to the level of deaths because of the absence of media fatigue or because there was less to report. We lean toward the former explanation because Reuters did pick up on the sharp increase in deaths during the latter months of 1992 and the first half of 1993. Unfortunately, we do not have reliable PHRIC data beyond 1994 and it is not possible to investigate this further.
The Effects of Coding Schemes on Early Warning
The patterns of political behavior found in an event data set are a function not only of the reports available in the media, but also the coding scheme used to convert the textual reports to nominal or interval codes that are analyzed using statistical techniques. These codes are necessarily much simpler than the natural-language reports—that is the whole point of event data—but the level of detail varies substantially between coding schemes. For example the COPDAB system (Azar 1982) used a very simple 16-category conflict-cooperation scale, whereas the contemporaneous WEIS system used 63 nominal categories, but still generally followed a cooperation-conflict scheme. In contrast, the PANDA project (Bond, Bennett &Vogele 1994, Bond et al. 1997) almost doubled the number of categories found in WEIS, while preserving compatibility with that scheme, and the BCOW scheme (Leng 1987) uses more than 100 categories of behavior with clear differentiations between verbal, economic and military activity. The aggregation of events using scales such as those proposed by Goldstein (1992) or Azar &Sloan (Azar 1982) introduces still another set of parameters when converting the textual reports into data that can be analyzed using statistical techniques.
The question we will examine here is how much information is lost through the process of aggregation. We will explore this by looking at the effects that different data sets—all based on the same Reuters reports—have on an early warning model we developed for the cluster analysis of dyadic behaviors in the Middle East (Schrodt &Gerner 1996). The event data set was machine-coded from Reuters lead sentences obtained from the NEXIS data service for the period April 1979 through July 1996. 3 We coded these data using the Kansas Event Data System (KEDS) machine-coding program (Gerner et al. 1994; Schrodt, Davis &Weddle 1994); the KEDS system is described in more detail in the Appendix.
In the original analysis we converted the individual WEIS events to a monthly net cooperation score using the numerical scale in Goldstein (1992) and totaling these numerical values for each of the directed dyads for each month. We examined all the dyads involving interactions among Egypt, Israel, Jordan, Lebanon, the Palestinians, Syria, United States and Soviet Union/Russia except for the USA > USR and USR > USA dyads; this gives a total of 54 directed dyads with 208 monthly totals in each dyad. A clustering measure called LML—which is based on the correlation between dyadic scores—proved very effective in determining politically plausible clusters, and a measure of cluster density called ?8CD typically gave three to six months early warning of transitions between these clusters.
In this analysis, we will examine the effects on these two early measures of using increasingly aggregated levels of measurement. In effect we are progressively reducing the amount of information extracted from the Reuters reports and can study the effects that this more limited information has on the early warning indicators. If these indicators are very sensitive to the details reported in the Reuters reports, we would expect to see a substantial deterioration in the accuracy of the clustering; if the indicators are insensitive, indicators obtained with the crude levels of measurement will produce roughly the same results as those produced from the more detailed indicators.
The LML and ?8CD analyses use a set of total monthly dyadic scores that are generated from the individual WEIS-coded events in the data sets. By changing the weights that we use to compute these totals, we can change the level of aggregation. We will examine six levels of aggregation:
| Goldstein: | Goldstein weights averaged within each two-digit WEIS category 4 |
| difference: | cooperative events = 1; conflictual events = -1. This corresponds to the difference between the number of cooperative and conflictual events |
| constant: | all events = 1. This is simply the total number of events in a month |
| cooperation: | cooperative event = 1; conflictual events = 0. This is the total number of cooperative events in a month |
| conflict: | cooperative event = 0; conflictual events = 1. This is the total number of conflictual events in a month |
| report: | 1 if at least one event occurred during the month for the dyad; 0 otherwise. |
In these aggregations, cooperative events are WEIS categories 01 through 10; conflictual events are WEIS categories 11 through 22.
Table 2 reports the correlation of the LML and ?8CD curves produced by the various weights; virtually all of the correlations between these curves are significant. 5 In general, the pattern of correlation follows our expectations: The correlation decreases as the amount of information decreases, particularly with respect to the Report weighting system, which has the lowest correlations. The exception to this pattern is found in the correlations of the Goldstein weighting with the weights involving cooperative events: for example the correlation between the Goldstein weighting system and the count of cooperative events (Coop) is only slightly better than the correlation between Goldstein and Report for the LML clustering measure and only half the value for the ?8CD early warning measure.
Table 2: Correlations of the LML and ?8CD values for various weighting systems
| Correlations of LML Clustering Values | |||||
| Goldstein | Report | Constant |
Coop- Conf |
Coop | |
| Report | 0.31 | ||||
| Constant | 0.58 | 0.11 | |||
| Coop- Conf |
0.35 | 0.16 | 0.38 | ||
| Coop | 0.32 | -0.07 | 0.76 | 0.39 | |
| Conf | 0.74 | 0.23 | 0.77 | 0.23 | 0.40 |
| Correlations of ?8CD Early Warning Values | |||||
| Goldstein | Report | Constant |
Coop- Conf |
Coop | |
| Report | 0.49 | ||||
| Constant | 0.53 | 0.32 | |||
| Coop- Conf |
0.40 | 0.36 | 0.37 | ||
| Coop | 0.21 | 0.15 | 0.69 | 0.14 | |
| Conf | 0.73 | 0.40 | 0.76 | 0.28 | 0.39 |
While there is a considerable loss in the percentage of the variance explained as we change the level of event aggregation , this does not necessarily imply that there will be comparable changes in the clusters that are identified by the measures. These clusters are shown in Figure 9, which identifies the cluster boundaries—determined by the ?LML > 0.15 criterion—that result from the various weightings. The dotted vertical lines show the a priori cluster boundaries that we had determined to best characterize the political behavior in the region. Table 3 shows the number of cluster boundaries that occur within ±3 months of the Goldstein and a priori boundaries.
| Figure 9: Cluster boundaries under various weighting systems |
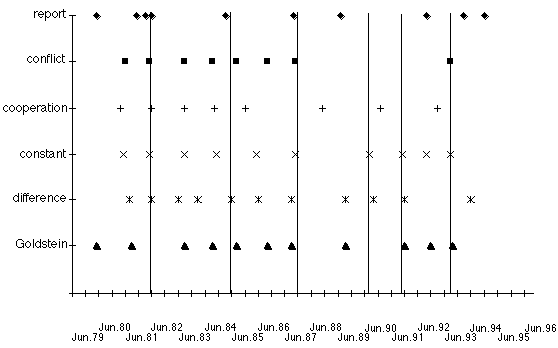
| Alternative weight vectors: | |
| Goldstein: | Goldstein weights averaged within each two-digit WEIS category. |
| difference: | cooperative events = 1; conflictual events = -1. |
| constant: | all events = 1. |
| cooperation: | cooperative event = 1; conflictual events = 0. |
| conflict: | cooperative event = 0; conflictual events = 1. |
| report: | 1 if any event occurred during the month; 0 otherwise |
| (cooperative events are WEIS 01 through10; conflictual events are WEIS 11 through 22.) | |
Table 3: Correspondence between cluster boundaries generated by weighting systems
| Goldstein (N=11) |
a priori
(N=6) |
|
| difference | 8 | 5 |
| constant | 6 | 5 |
| cooperation | 3 | 1 |
| conflict | 6 | 4 |
| report | 3 | 3 |
| Goldstein | — | 4 |
The qualitative cluster divisions produced by the alternative weighting schemes show considerably higher correspondence with the Goldstein and a priori divisions than might be expected from Table 2. For example, the constant vector—where all event types are weighted equally—has a high level of correspondence with the divisions found by the other methods; the difference variation on this does as well in matching the a priori transitions but (unsurprisingly) corresponds more closely to the Goldstein divisions than does the constant vector. Once again, the vector with the least correspondence to the other transitions—doing even worse than the highly simplified Report measure—considers only the cooperative events; in particular this has almost no correspondence with the a priori transitions.
In a separate analysis, we used a genetic algorithm to try to optimize the weighting scheme to locate our a priori clusters. 6 In a sense, that analysis goes in the opposite direction of the simplified weights by searching for the possibility of a superior weighting system more complicated than the Goldstein (1992) scaling. While none of the weight vectors produced by the genetic algorithms correlated significantly with the Goldstein (1992) weights, the genetic algorithm produced no dramatic improvements in the ability of the system is determine the cluster divisions. Furthermore, the LML and ?8CD curves produced by these new vectors correlated strongly with the curve produced by the constant vector—usually with r > 0.95 for LML and r > 0.85 for ?8CD. A variety of different experiments with the genetic algorithm failed to locate a weighting scheme that provided dramatic improvements over the Goldstein (1992) weighting or the event-count weighting schemes.
After one cautionary note, we can draw two general conclusions from this analysis of event aggregation. The cautionary note is that all of our analysis uses the event categories identified by WEIS and the robustness of the coding has only been evaluated with respect to the clustering algorithms used in Schrodt &Gerner (1996). It is possible that by coding for some other categories of behavior—for instance the coding of measures of internal political instability, where the WEIS scheme is weak—would provide substantially more sensitive indicators than those provided by the WEIS categories. Different statistical models will also vary in their sensitivity, although the monthly aggregation techniques we have used in the clustering analysis are very typical of the methods used in event data analysis. Finally, the results we have found in the Levant—a geographical region that is receives fairly high levels of media attention—may not generalize to other regions of the world (although the effects of non-reports may be even more important in areas that receive less coverage).
With those caveats, this analysis implies that most of the information being used to differentiate clusters of political behavior is found in the event counts themselves, rather than the weighting of events. At least two factors might explain this. First, about 50% of the dyad-months in the data set have zero values, which are unaffected by any change in the weighting scheme. Second, the existence of any activity in a dyad might signal that Reuters reporters or editors think that the dyad is experiencing politically important activity. This is particularly true with respect to verbal activities where in all likelihood Reuters has a great deal of discretion in reporting or not reporting activity.
This lack of sensitivity to event weights has an important implication for the use of machine-coded data for forecasting purposes. While machine-coding is more consistent over time than human-coded data, machine-coding is less sensitive to nuances of reported political behavior, and it is possible that those nuances could be very important in a problem such as forecasting. Our analysis, however, does not support such a conclusion: Because similar results can be obtained despite huge differences in the weighting of event categories, there is little evidence that subtle distinctions in the coding of events would have a major effect on the ability of a statistical model to produce correct forecasts. Furthermore, machine-coding is very unlikely to make errors in creating an event that is completely unrelated to a dyad. 7
The forecasting measure ?8CD may be sensitive primarily to changes in Reuters coverage of the region. Consequently, another possible interpretation of the success of the ?8CD measure might be that it reflects, in an aggregate fashion, changes in the importance that various Reuters reporters and editors assign to events. If those reporters anticipate that a political shift is forthcoming in a region, they are likely to devote more coverage to it. In other words, ?8CD may actually be an indirect measure of events that are known by the Reuters organization but not necessarily reflected in the events reported in lead sentences coded in the event data. This information can nonetheless be used for early warning.
Conclusion
The analysis in this chapter has two implications for statistical early warning. First, the presence of media fatigue in newswire and newspaper sources suggest that early warning models might benefit from greater attention to specialized reports such as those available through ReliefWeb and other IGO and NGO reports; this is particularly important in projects that are attempting to do long-term monitoring where media fatigue is likely to occur. Second, much of the variance provided by media sources such as Reuters and NYT is in the existence of the reports—whether a region is being covered at all—rather than in the detailed content of those reports. Because of this limitation, complex coding schemes requiring expert interpretation of news reports are unlikely to provide significantly more information than simpler coding schemes such as those that can be effectively implemented with all-machine coding.
The media fatigue effect in protracted conflicts may look something like Figure 10: an initial interest followed by a slump in coverage followed by sustained interest. The timing of the phases may be differ somewhat between sources: for example, NYT seems to have sustained its initial interest in the intifada longer than did Reuters, probably because of the interest in this issue found among the relatively high number of Jewish readers in New York City. Because of the impact of the Soviet Union–Eastern Europe and Iraq–Kuwait, the pattern we found in the intifada was not as clean as the hypothetical pattern.
| Figure 10: Hypothetical Media Fatigue Pattern |
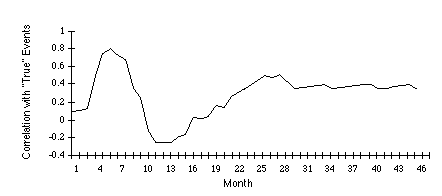
The media fatigue results are reassuring in some respects, but they also point to cautions for future research. Neither the short-term pattern of interest-followed-by-decline nor the impact of competing news stories was unexpected, although in our earlier work we underestimated the impact of the second factor, particularly on Reuters. In the intifada this initial period of fluctuating attention is followed by a long period of sustained and quite consistent news coverage The sustained interest suggests that journalistic sources could be reliable for monitoring at least some protracted conflicts. With sufficiently sophisticated models and the use of multiple sources, it should be possible to compensate (at least partially) for coverage effects. For instance, one could use the reduced correlations in reports by multiple sources (e.g. Reuters, Agence France Presse, and NYT) to signal periods of reduced coverage. Electronic news providers such as LEXIS–NEXIS and Reuters Business Briefing now provide stories from hundreds of different news sources, so these correlations would be easy to compute.
The second part of our analysis indicated that simple event counts are much more important than detailed weighting scheme and differentiation between events. While these results may be specific to the Levant, the WEIS coding scheme and our cluster-based early warning indicators, but we suspect that the phenomenon is general. If the reporters and editors of Reuters are good intuitive political analysts—and there is little reason to assume otherwise, particularly for this intensely covered region—then the frequency of reported events in circumstances that may be undergoing political change will be higher than those in relatively static situations. From a “god’s eye view”, this is sloppy and introduces an additional possible source of error. But we aren’t gods; we are event data analysts and we can only study what is available in Reuters or comparable sources. This is not to make a virtue of the necessity of relying on Reuters, but simply an observation that Reuters’ filtering for politically-relevant events seems to be doing a pretty good job for purposes of forecasting.
More generally, these results bring into question any “more is better” approach to the development of scheme for event data coding schemes for use in humanitarian crisis forecasting and monitoring. Simple coding schemes such as those found in WEIS or PANDA can be effectively in implemented for all-machine coding: this means that internally consistent data can be produced inexpensively in real time. More complicated schemes, in contrast, may require judgment calls that only a human coder can make and thus cannot be fully machine coded. Human coding dramatically increases the cost of providing data, the human-coded data sets have questionable consistency over time, and, to date, no coding system requiring human intervention—including the lavishly funded DARPA projects from the 1970s—has been able to provide event data at a level even approaching real-time coverage.
The human-coded data sets unquestionably provide a far richer set of information than that provided by the WEIS or PANDA systems. However, all of these data sets are subject to the same constraints in terms of their reliance on international news media sources: No coding scheme, however elaborate, can extract information from a report that does not exist. The analysis we have presented here suggests that the mere existence of those reports provides much of the “signal” that is available for early warning. While it is possible that human-coded event coding schemes can extract sufficient additional information from the existing reports to provide a significant advantage over the simpler machine-coded reports, but this needs to be shown statistically rather than assumed. Our sense is that much more can be gained by expanding early warning systems to include a greater number of electronically-available sources—particularly IGO and NGO reports—and by developing more sophisticated statistical techniques, rather than by creating more elaborate (and expensive) coding schemes.
The qualitative opportunities for acquiring information relevant to early warning has increased dramatically in the past five years with the availability of inexpensive machine-readable commercial news sources and the proliferation of reports available from IGOS and NGOs via the Internet. During this same period the challenges have also increased, for example in the potential dissolution of some states in the post-Cold War period and the appalling resurgence of genocidal outbreaks such as those witnessed in Cambodia, Rwanda and Bosnia. Consequently we believe that there is an important role for the development of techniques using quantitative indicators. To the extent that a geographical area is adequately monitored by electronically-readable sources, real-time quantitative forecasting using machine-coded event data is quite inexpensive and can easily operate in the background as a supplement to qualitative forecasting.
Bibliography
Azar, Edward E. 1982. The Codebook of the Conflict and Peace Data Bank (COPDAB). College Park, MD: Center for International Development, University of Maryland.
Azar, Edward E. and Joseph Ben-Dak. 1975. Theory and Practice of Events Research. New York: Gordon and Breach.
Azar, Edward E., Richard A. Brody, and Charles A. McClelland, eds. 1972. International Events Interaction Analysis: Some Research Considerations. Beverly Hills: Sage Publications.
Bond, Doug, Bennett, Brad and Vogele, William 1994. Data development and interaction events analysis using KEDS/PANDA: an interim report. Paper presented at the International Studies Association, Washington.
Bond, Doug, J. Craig Jenkins, Charles L. Taylor and Kurt Schock. 1997. “Mapping Mass Political Conflict and Civil Society: The Automated Development of Event Data” Journal of Conflict Resolution 41,4:553–579.
Burgess, Philip M. and Raymond W. Lawton. 1972. Indicators of International Behavior: An Assessment of Events Data Research. Beverly Hills: Sage Publications.
Doran, Charles F., Robert E. Pendley, and George E. Antunes. 1973. A Test of Cross-National Event Reliability. International Studies Quarterly 17:175–203.
Gerner, Deborah J., Philip A. Schrodt, Ronald A. Francisco, and Judith L. Weddle. 1994. The Machine Coding of Events from Regional and International Sources. International Studies Quarterly 38:91–119.
Goldstein, Joshua S. 1992. “A Conflict-Cooperation Scale for WEIS Events Data.” Journal of Conflict Resolution 36: 369–385.
Laurance, Edward J. 1990. “Events Data and Policy Analysis.” Policy Sciences 23:111–132.
Leng, Russell J. 1987. Behavioral Correlates of War, 1816–1975. (ICPSR 8606). Ann Arbor: Inter-University Consortium for Political and Social Research.
McClelland, Charles A. 1976. World Event/Interaction Survey Codebook. (ICPSR 5211). Ann Arbor: Inter-University Consortium for Political and Social Research.
Merritt, Richard L., Robert G. Muncaster, and Dina A. Zinnes, eds. 1994. Management of International Events: DDIR Phase II. Ann Arbor: University of Michigan Press.
Palestine Human Rights Information Center (PHRIC). 1993. Human Rights Violations Under Israeli Rule During the Uprising. Washington, DC: PHRIC.
Schrodt, Philip A. and Deborah J. Gerner. 1994 . “Validity assessment of a machine-coded event data set for the Middle East, 1982–1992.” American Journal of Political Science 38: 825–854.
Schrodt, Philip A. and Deborah J. Gerner. 1996. “Using Cluster Analysis to Derive Early Warning Indicators for the Middle East, 1979–1996” Paper presented at the American Political Science Association, San Francisco. (http://wizard.ucr.edu/polmeth/working_papers96/schro96.html)
Schrodt, Philip A., Shannon G. Davis and Judith L. Weddle. 1994. “Political Science: KEDS—A Program for the Machine Coding of Event Data.” Social Science Computer Review 12,3: 561–588.
Tomlinson, Rodney G. 1993. World Event/Interaction Survey (WEIS) Coding Manual. Manuscript, United States Naval Academy, Annapolis, MD.
Appendix: The Kansas Event Data System
The Kansas Event Data System (KEDS) is a system for the machine coding of international event data based on pattern recognition and sparse parsing of natural language reports. It is designed to work with short news summaries such as those found in wire service reports. To date, KEDS has primarily been used to code WEIS events (McClelland 1976) from the Reuters news service lead sentences but in principle it can be used for other event coding schemes and news sources.
Historically, event data have usually been hand-coded by legions of bored undergraduates flipping through copies of The New York Times. Machine coding provides two advantages over these traditional methods:
The disadvantage of machine coding is that it cannot deal with sentences having a complex syntax and it deals with sentences in isolation rather than in context.
KEDS can be used for either machine-assisted coding or fully automated coding. Coded events can be manually edited on the screen before they are written to a file, and the program has a “complexity detector” that can divert linguistically complex sentences—for example those containing a large number of verbs or subordinate clauses—to a separate file for later human coding.
KEDS combines simple syntactic analysis and pattern recognition to do its coding. Three types of information are used:
| Actors: | These are proper nouns that identify the political actors that are differentiated in the coding system; |
| Verbs: | Event data categories are primarily distinguished by the actions that one actor takes toward another, so the verb is usually the most important part of a sentence for determining the event code; |
| Phrases: | Phrases are used to distinguish different meanings of a verb—for example PROMISED TO SEND TROOPS versus PROMISED TO CONSIDER PROPOSAL—and to provide syntactic information on the location of the source and target within the sentence. |
KEDS relies on sparse parsing of sentences—primarily identifying proper nouns (which may be compound), verbs and direct objects within a verb phrase — rather than using full syntactical analysis. As a consequence KEDS will make errors on complex sentences or sentences using unusual grammatical constructions, but it requires less information to deal with the sentence structures that are most commonly encountered in news articles and has proven quite robust in correctly interpreting those types of sentences. Because the dictionaries are relatively simple to construct—and dictionaries that already cover most English-language vocabulary are available from the KEDS and PANDA projects—the start-up costs for a new coding project are relatively low, and it is easy to experiment with the construction of alternative coding systems.
Suggested Readings
This annotated bibliography gives citations to the primary published papers from the KEDS project, as well as some surveys of contemporary event data analysis and computational methods for processing natural language. The KEDS program, data sets, papers and other information are available at the KEDS web site: http://www.ukans.edu /~keds
KEDS
Gerner, Deborah J., Philip A. Schrodt, Ronald A. Francisco, and Judith L. Weddle. 1994. “The Machine Coding of Events from Regional and International Sources.” International Studies Quarterly 38:91–119.
| – | Description of the DDIR-sponsored KEDS research; includes tests on German-language sources and a foreign affairs chronology. |
Schrodt, Philip A. and Deborah J. Gerner. 1994. “Validity Assessment of a Machine-Coded Event Data Set for the Middle East, 1982–1992.” American Journal of Political Science location of the sour38:825–854.
| – | Statistically compares KEDS data to a human-coded data set covering the same time period and actors. |
Schrodt, Philip A., Shannon G. Davis and Judith L. Weddle. 1994. “Political Science: KEDS—A Program for the Machine Coding of Event Data.” Social Science Computer Review 12,3: 561–588.
| – | A technical description of KEDS with an extended discussion of the types of problems encountered when machine-coding Reuters reports. |
Huxtable, Phillip A. and Jon C. Pevehouse. 1996. “Potential Validity Problems in Events Data Collection.” International Studies Notes 21,2: 8–19.
| – | Analysis of source bias problems comparing Reuters, Agence France Press and United Press International. |
Schrodt, Philip A. and Deborah J. Gerner. 1997. Empirical Indicators of Crisis Phase in the Middle East, 1982–1995. Journal of Conflict Resolution 41:529–552.
| – | A comparison of three statistical techniques—factor analysis, discriminant analysis and cluster analysis—in differentiating phases of political activity in the Levant. |
Event Data
Schrodt, Philip A. 1994. “Event Data in Foreign Policy Analysis” in Laura Neack, Jeanne A.K. Hey, and Patrick J. Haney. Foreign Policy Analysis: Continuity and Change. New York: Prentice-Hall, pp. 145–166.
| – | Textbook-level introduction to the general topic of event data analysis. |
Duffy, Gavin, ed. 1994. International Interactions 20,1–2
| – | Special double-issue on event data analysis. |
Merritt, Richard L., Robert G. Muncaster, and Dina A. Zinnes, eds. 1994. Management of International Events: DDIR Phase II. Ann Arbor: University of Michigan Press.
| – | Reports from the National Science Foundation-sponsored Data Development in International Relations (DDIR) event data projects. |
Computational Methods for Interpreting Text
Advanced Research Projects Agency (ARPA). 1993. Proceedings of the Fifth Message Understanding Conference (MUC–5). Los Altos,CA: Morgan Kaufmann.
| – | Reports from a large-scale ARPA project on developing computer programs to interpret news reports on terrorism in Latin America; these use a variety of different techniques. |
Evans, William. 1996. “Computer-Supported Content Analysis: Trends, Tools and Techniques.” Social Science Computer Review 14,3: 269–279.
| – | Current survey of content-analysis programs; also see Evan’s very thorough web site on content analysis: http://www.gsu.edu/~wwwcom/content.html |
Pinker, Steven. 1994. The Language Instinct. New York: W. Morrow and Co.
| – | Excellent non-technical introduction to contemporary linguistics; extensive discussion of the problems of parsing English |
Salton, Gerald. 1989. Automatic Text Processing. Reading, Mass: Addison-Wesley.
| – | General introduction to the use of computers to process text; covers a wide variety of methods. |
Endotes
Note 1: Development of KEDS was funded by the National Science Foundation through Grants SES89–10738, SBR–9410023 and SES90–25130 (Data Development in International Relations Project) and the University of Kansas General Research Fund Grant 3500–X0–0038. The KEDS program, data sets and other information are available at the KEDS web site: http://www.ukans.cc.edu/~keds Back.
Note 2: The moving correlations for the WEIS Force events are almost identical to those for net conflict; we did not have the force events tabulated for the NYT data so we are using the net conflict scores in both cases to make them comparable. Back.
Note 3: The NEXIS search command used to locate stories to be coded was
| (ISRAEL! OR PLO OR PALEST! OR LEBAN! OR JORDAN! OR SYRIA! OR EGYPT!) AND NOT (SOCCER! OR SPORT! OR OLYMPIC! OR TENNIS OR BASKETBALL) |
Note 4: Comparable results were obtained for an analysis based on 3-digit WEIS categories; details on this study are available from the authors. Back.
Note 5: The critical values (N=196; one-tailed test) are r > 0.118 (0.05 level ); r > 0.165 (0.01 level ) and r > 0.218 (0.001 level ) Back.
Note 6: A technical report on these experiments is available from the authors. Back.
Note 7: In machine coding, the most common actor-assignment error is confusing the object of an action with an indirect object or a location. A machine coding will not, however, create a actor that is not mentioned in the text. For example, if a series of events involves Israel, Syria, Lebanon and the Palestinians, some actions of Israel towards Syria might be incorrectly coded as applying to Lebanon or the Palestinians. However, machine-coding would never create an extraneous Egypt–Jordan event from these texts. Because our forecasting model assumes clusters of activities, it will generally be insensitive to a few incorrect assignments of targets. Back.