|
|
|
|

Political Science Quarterly
Volume 116 No. 1 (Spring 2001)
A House and Senate Divided:
The Clinton Legacy and the Congressional Elections of 2000
By Gary C. Jacobson
Gary C. Jacobson is professor of political science at the University of California, San Diego. His most recent books are The Politics of Congressional Elections (5th ed.) and The Logic of American Politics (coauthored with Samuel Kernell).
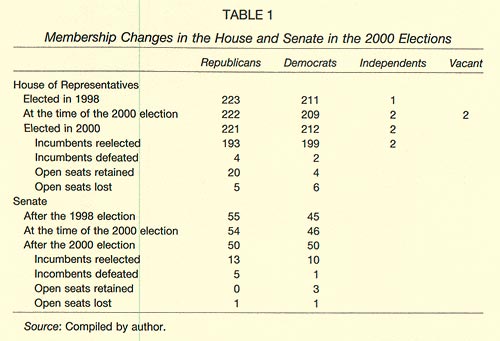
Bill Clinton entered the White House in January 1993 with his fellow Democrats solidly in control of the House and Senate. When he moved out in January 2001, Republicans were in full control of the federal government for the first time since 1954. Yet the Republican majorities were, to say the least, exceedingly tenuous. Al Gore had actually won the popular plurality by a margin of nearly 540,000 votes, but George W. Bush eked out a 271-267 electoral college victory when, after more than five weeks of legal maneuvering, the U.S. Supreme Court settled the dispute over the Florida vote count in his favor. 1 The election left the Senate split precisely in half, Republicans and Democrats each holding fifty seats; the Republicans retained control because the vice president, Republican Dick Cheney, casts tie-breaking votes. The Republicans held on to their slim majority in the House of Representatives, a net loss of two seats leaving them with a 221-212 margin. 2 Table 1 summarizes the congressional results.
The 2000 elections were as close to a dead heat across the board as we are ever likely to see. Yet they were not the least anomalous. They accurately represent the close partisan balance now prevailing in the United States. Because no discernable partisan tide was running in 2000 and the rate of party line voting was, according to the exit polls, the highest in decades, the outcomes reflect the underlying partisan balance in the electorate with unusual clarity. They reveal two national parties more evenly matched in terms of popular support than at any time since the nineteenth century, but with a distinct regional and cultural divide between their electoral coalitions.
The campaigns of 2000 did not, however, reflect the intense partisan polarization that has characterized U.S. national politics during the past decade, because the battles for control of the White House and Congress were fought in swing states and districts and for the support of independent-minded swing voters, circumstances that discouraged partisan appeals or even mention of party. Only after the election, in the dispute over how Florida's ballots would be counted, did the full fury of partisan conflict emerge. Members of Congress and other activists on both sides saw the struggle as another round in the fierce partisan warfare that was a defining feature of national politics during the Clinton years. Although ordinary Americans watched the legal and rhetorical squabbling with considerable detachment (neither Bush nor Gore excited widespread popular passions), they, too, divided sharply along partisan lines in their reactions to the events in Florida, just has they had over Clinton's impeachment in 1998-1999.
The close partisan balance in Congress and in the electorate, the regional and cultural divisions between the parties' respective electoral coalitions, and the stark partisan polarization among the parties' politicians and activists, which are are echoed, though more faintly, in the broader public, represent significant long-term trends in U.S. politics. These trends clearly predate the 1990s, but each accelerated during the Clinton years, and Clinton himself played a catalytic role in shaping the political alignments exposed by the 2000 elections. The configuration of partisan forces revealed and installed in Washington by the election poses an enormous challenge to the incoming Bush administration and to members of Congress on both sides hoping to avoid unproductive legislative stalemate.
My purpose in this article is to examine the elections of 2000 in their immediate context, as the product of long-term trends in American electoral politics, and as a legacy of the Clinton years. I focus on the House and Senate elections--the presidential election requires a separate analysis to do it justice--except as the presidential contest impinged on the congressional races. I also consider the implications of the elections, the partisan forces they expressed, and their aftermath for the first administration and Congress of the new millennium.
Neutral Partisan Forces
The root source of the congressional and presidential standoff produced by the 2000 election lies in the electorate itself. The substantial popular majority among party identifiers that Democrats had enjoyed since the New Deal was largely gone by the mid-1980s, a change traceable largely to realignment of southerners and social conservatives into the Republican camp. 3 Democrats have since retained a small advantage among party identifiers in most polls, 4 but because self-identified Republicans are more likely to vote and are slightly more loyal to their party when they do, the normal electoral balance is now nearly even.
The congressional election results mirrored this close partisan balance because national forces were essentially neutral in 2000. The razor-thin margin separating Bush and Gore meant that neither party benefited nationally from presidential coattails. Nor did any other national conditions clearly favor one party over the other. Unlike 1994, but like 1996 and 1998, 5 the electoral environment in 2000 broadly favored the congressional status quo. The economy continued to look strong through election day. Modest inflation, low unemployment, rising family incomes, a growing federal budget surplus, and declining rates of crime and welfare dependency had left the public largely satisfied with the direction of the country and approving of its elected leaders.
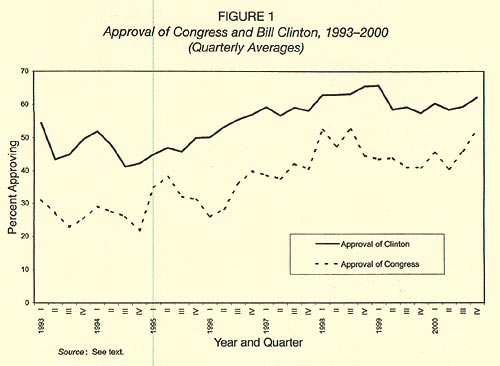
Clinton obviously benefited from these positive trends, enjoying high levels of public approval; but so did members of Congress. As Figure 1 shows, even though Clinton and the Republicans were often at bitter odds with one another, public approval of the president and Congress showed a remarkable tendency to move in parallel during the Clinton years regardless of which party controlled the Congress. 6 During the eight quarters of unified government in 1993-1994, 7 the quarterly averages of congressional and presidential approval ratings were correlated at .73; during the twenty-four quarters of divided government, they were correlated at .77. The average gap between presidential and congressional approval ratings was actually higher during Clinton's first two years as president (21 points) than during his final six (17 points). At the time of the 2000 elections, both Clinton and the Republican Congress were enjoying unusually high levels of approval by historical standards. The most plausible reason why public approval of the president and a Congress dominated by his enemies moved in rough parallel is that many Americans evaluate both branches by the same criteria, namely the economy and the general state of the nation.
The House Elections
The high level of public satisfaction with Congress and the absence of a discernible partisan tide had a predictably dampening effect on House competition in 2000. 8 Only the most vulnerable incumbents attracted formidable, well-funded opponents; and in the end, only six incumbents--four Republicans and two Democrats--were defeated in the general election. 9 Many of the thirty-five open seats were not hotly contested, because the district's partisan makeup so clearly favored one of the parties. Most of these noncompetitive open seats were held by Republicans, so that although the Republicans had to defend twenty-five open seats to the Democrats' ten, they actually enjoyed a net gain of one open seat on election day.
The battle for control of the House was thus highly concentrated in a small number of seats, where unprecedented sums were spent by both the candidates and various independent and "voter education" campaigns operating outside the regular campaigns' purview. 10 Most prominent among the handful of incumbents who did attract vigorous opposition were Republicans from Democratic-leaning districts who had defied the manifest wishes of a majority of their constituents by voting to impeach Clinton. Three of the four Republican incumbents who lost fell into this category: California's Brian Bilbray and James Rogan, both representing districts where Clinton had won 55 percent of the major-party vote in 1996, and Jay Dickey of Arkansas, representing a district where Clinton had won 66 percent. But Republicans as a group escaped punishment for their widely unpopular move to oust the president by the simple fact that it failed. Most voters got what they wanted--continuation of the Clinton presidency--and saw no reason to punish Republicans wholesale for the attempt. Just as good times helped Clinton to survive the impeachment process, 11 the strong economy probably helped protect the Republicans in Congress from any impeachment backlash by encouraging public contentment with the status quo.
Also contributing to an uneventful election was the House Republicans' shrewd defensive campaign strategy that was, ironically, almost the exact inverse of the one that had given them their majorities in 1994. Rather than campaign as a team pledged to a common program as they had with the "Contract with America" in 1994, Republican campaigns in 2000 centered on individual candidates and locally important issues. 12 Instead of boldly challenging Clinton, congressional Republicans sought after impeachment to avoid confrontations with the president at all costs. Democrats had hoped to make the Republican Congress an issue, but congressional Republicans carefully avoided battles that would remind voters either of the 1995 government shutdown or impeachment, instead curbing their ideological rhetoric and rolling out the pork barrel. 13
In the end, relatively few seats changed party control (seventeen, tied for third lowest among the twenty-seven post-World War II congressional elections). But on balance, the changes that occurred increased the partisan match between districts and members, extending one of the most important developments of the Clinton era. Table 2 displays some illustrative data. It divides districts according to whether the district-level presidential vote for the winning House candidate's party (measured as the percentage of major party vote) was above, below, or near the national average. 14 Representatives whose party's presidential candidate ran two or more percentage points below his national average in the district are considered at risk. Those whose party's presidential candidate ran two or more points ahead of his national average are considered comparatively safe. The rest are deemed competitive.
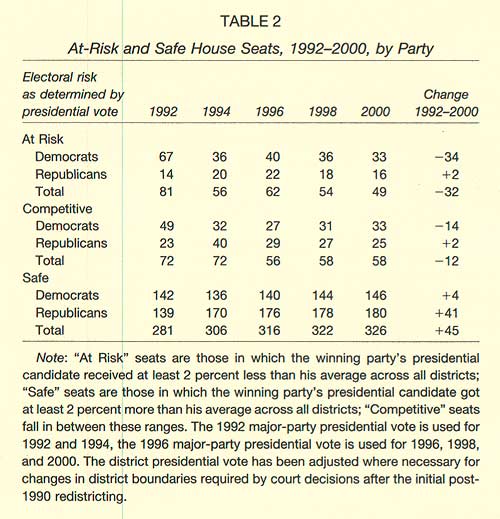
The data in Table 2 reveal what happened in 1994. Although Clinton entered the White House as a centrist New Democrat, his most conspicuous actions during his first two years--support for gays in the military, pushing through gun control legislation, the failed attempt at comprehensive health care reform, a tax increase as part of his deficit reduction package--branded him a liberal and generated a conservative backlash that helped Republicans take control of the House. 15 The administration's actions in the context of unified Democratic control of the federal government inspired Republicans and conservatives who had been voting for House Democrats to switch to Republican candidates. Consequently, a large majority of the seats Republicans picked up in 1994 were in districts that, according to their presidential voting habits, should have been Republican all along. Clinton was thus an unwitting catalyst in a process that enabled the Republicans' congressional wing finally to reap the benefits of the rise in Republican party identification of a decade earlier. 16
Because most of the districts Republicans took over in 1994 already leaned Republican, the party had little trouble holding onto most of them through the rest of the decade. More generally, the data in Table 2 show that districts held by the "wrong" party and districts with a competitive party balance both became rarer during the decade, while the number of districts where presidential and House voting were aligned grew substantially, mainly to the benefit of Republicans. This development raised the odds against either party taking seats from the other in the absence of a strong national tide in its favor and thus contributed to the narrow range of competition for House seats in 2000.
The House balance has been very stable and unusual since 1994. Republicans have held onto the House for four consecutive elections for the first time since the 1920s, but with majorities much smaller than those typically enjoyed by the Democrats during the era of Democratic dominance initiated by the New Deal. Indeed, they form the narrowest House majorities elected in any four consecutive elections in U.S. history. As long as the closely divided House reflects a closely divided electorate, control of the House will remain too close to call, as it was in 2000, in any election without a strong partisan tide. It is virtually certain to be up for grabs again in 2002, and awareness of that reality is bound to pervade legislative politics during the 107th Congress.
The Senate Elections
In contrast to the House elections, the Senate elections did alter the status quo in 2000. Republicans lost five seats, leaving the Senate evenly divided between the parties for only the second time in U.S. history. Democrats picked up one seat in July, when Republican Paul Coverdell of Georgia died and Georgia's Democratic governor appointed Democrat Zell Miller to take his place; Miller easily won a special election on 7 November to fill out the remaining four years of Coverdell's term. The Democrats gained four additional seats on election day, defeating five incumbent senators to the Republicans' one, with each party losing a single open seat.
The Democrats' gains in the Senate did not, however, reflect any national partisan trend, but rather the absence of one. Turnover is typically higher in Senate elections. On average, Senate incumbents are about three times as likely to lose as House incumbents. 17 Senators are much more likely than representatives to face stiff competition and to lose elections, because a much larger proportion of states than districts have a sufficiently close partisan balance to make them winnable by either party. During the past two decades, no fewer than forty of the fifty states have been served by senators from both parties. Of the remaining ten states, only one (Hawaii) did not elect at least one governor of the party opposite of their senators. Brighter electoral prospects attract a larger number of the talented, well-funded challengers who are essential for competitive contests. As a result, in the average election year about half the Senate races are hotly contested compared with less than 15 percent of the House races. 18 The 2000 election was fairly typical in this regard, with ten seats won with less than 55 percent of the major party vote and sixteen seats won with less than 60 percent.
Senators run on a six-year rather than a two-year cycle, which can also lead to different patterns of competition in House and Senate races. When a strong partisan tide produces large House and Senate gains for a party, the representatives who ride in on the surge are in danger two years later. The senators serve six years before they face the prospect of reelection under less favorable circumstances than when they were first elected. For example, Republicans had an excellent year in 1980, picking up thirty-four House seats and twelve Senate seats, and winning a majority in the upper chamber for the first time since 1952. They quickly gave up most of their House gains, losing twenty-six seats after only two years; but they did not suffer significant losses in the Senate until 1986, when the class of 1980 faced its first test and the Democrats picked up eight seats to regain majority status.
The 2000 Senate elections were the first test for several of the staunchly conservative Republicans who were first elected on the strong Republican tide of 1994. Three of the five Republican losers in 2000 were members of this class--John Ashcroft of Missouri, Rod Grams of Minnesota, and Spencer Abraham of Michigan. All three were burdened with images that put them well to the right of their constituents. Thus part of the reason Democrats pulled even in the Senate is that the strong Republican tide that had prevailed in 1994 was no longer running.
With the presidential election essentially tied, it would seem that neither party's Senate candidates could derive much of a boost from the top of the ticket. Although no national trend favored either party, some distinctive state currents generated by the presidential campaign probably affected several Senate races. 19 Overall, there was a modest but detectable relationship between statewide presidential and Senate results. The incumbent party lost six of fourteen Senate seats in states won by the other party's presidential candidate, but only two of nineteen seats in states won by its own party's presidential candidate. One of the two was in Florida, where Gore may actually have received the most votes (we'll probably never know). The other was Missouri, which Bush won by a narrow margin. With the exception of Missouri's John Ashcroft, every losing incumbent was from a state won by the other party's presidential candidate.
Overall, twenty-four of thirty-four states cast a plurality of their votes for Senate and presidential candidates of the same party, precisely the same as in 1992 and 1996. Consistency in Senate and presidential voting has returned to the levels that prevailed in the 1950s and early 1960s, in contrast to the 1968-1988 period, when typically only about half the states were won by the same party's Senate and presidential candidates.
Regional Alignments
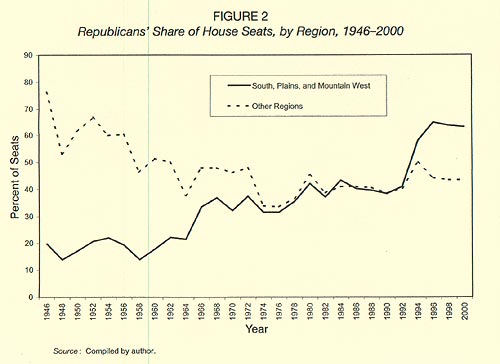
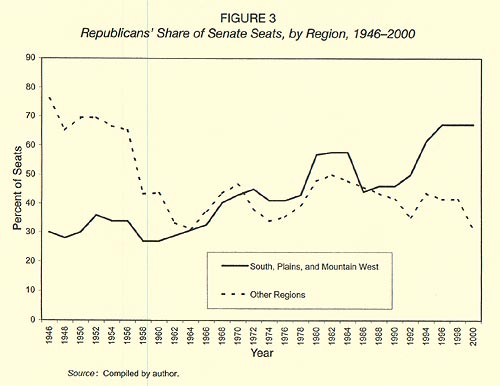
Like the close national vote for president, the close partisan balance in the House and Senate masks distinct regional differences in party strength. Reflecting the growing linkage between presidential and congressional election results, the regional divisions in the presidential vote reappear in House and Senate election results. Bush won twenty-five of the twenty-six states in the South, Plains, and Mountain West, losing only New Mexico. 20 After the 2000 elections, Republicans held 63 percent of the House seats and 67 percent of the Senate seats in these regions. Gore won nineteen of the twenty-four states in the Northeast, Midwest, and West Coast. 21 The congressional elections left Democrats holding 57 percent of the House seats and 69 percent of the Senate seats in these regions.
The alignments exposed by the 2000 elections represent the latest extension of a long-term trend in regional voting patterns in which the two parties have gradually exchanged areas of dominance. These changes are displayed in Figures 2 and 3, which show the regional distribution of House and Senate since 1946. Republican gains in the South, Plains, and Mountain West put the party in control of Congress in 1994 and have kept it in Republican hands since then. Insofar as Democrats have been able to undo any of the damage suffered in 1994, it has been in the Northeast, Midwest, and West Coast.
The regional divisions between the parties' electoral coalitions and the demographic and opinion differences that underlie them are readily apparent in the exit poll taken on election day. Recapitulating now familiar patterns, the poll showed that Republican House candidates were favored by men, whites, and married people; Democrats were favored by women, African Americans (overwhelmingly), Hispanics, and singles (Figure 4). 22 Regionally, voters in the Northeast favored Democrats, while southern voters favored Republicans. Midwesterners divided almost evenly, giving Republicans a very slight edge; westerners were split 50-50, but only because Democratic majorities in the coastal states were offset by the solidly Republican mountain states. Democrats prevailed among urban voters, Republicans among rural voters, with the suburbs divided almost evenly.
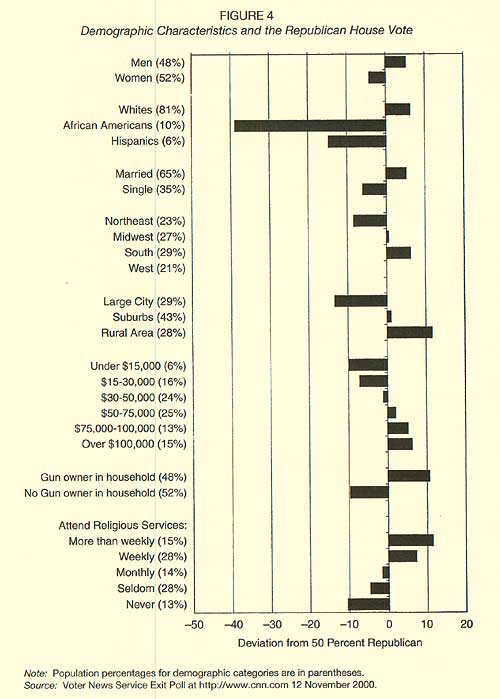
Conforming to traditional party class differences, the higher a voter's income, the more likely a vote for the Republican candidate. But notice that differences generated by two noneconomic factors--gun ownership and religiosity--are even larger than the differences associated with income. The difference in the House vote between the highest and lowest income categories is 16 percentage points, while the difference between people in households with and without guns is 20 percentage points, and between the most and least religiously active, 23 percentage points.
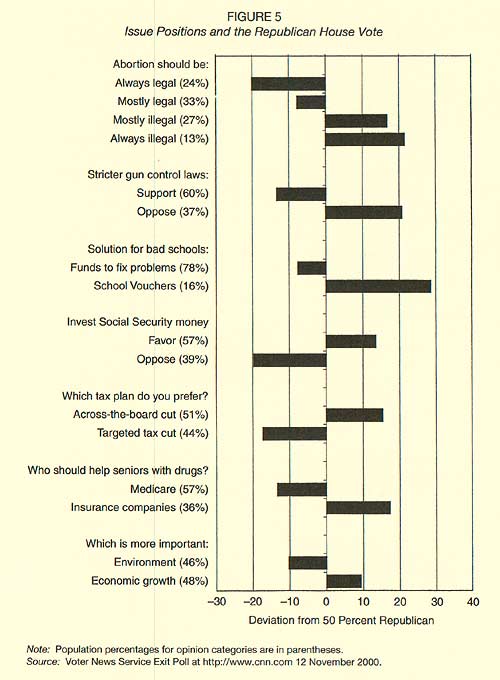
Analysis of voters' responses to issue questions, a selection of which are shown in Figure 5, reinforces the idea that the vote choice was strongly influenced by noneconomic considerations. The vote is most strongly related to responses to the abortion question, with people who think it should always be illegal voting 42 percentage points more Republican than people who think it should always be legal. The second largest difference is associated with support or opposition to school vouchers (36 points), the third largest, with opinions on gun control (34 points). On other issues that divided the presidential candidates--whether to invest a share of social security money in the stock market, how to cut taxes, how to make drugs more affordable for seniors--the gap is 31 to 33 percentage points. The House vote also divided over the trade-off between protecting the environment and encouraging economic growth.
In every case, the same demographic and issue-based divisions between the party coalitions reappear, usually magnified, in the presidential vote reported in the exit poll. 23 The Republican coalition in 2000 was disproportionately white, male, resident of states in the South, Plains, and Mountain West, fond of guns, religiously conservative, rural, married, and affluent. The Democratic coalition in the 2000 election was disproportionately female, minority, resident in the Northeast or West Coast, secular, unmarried, unarmed, and of modest means.
The stark regional and cultural division between the two parties is another legacy of the Clinton years. Although the shift in regional alignments continued a long-term trend, Figures 2 and 3 show that the most rapid shifts occurred during the Clinton administration, underlining his catalytic role in shaping the current party alignments. Ironically, Clinton had originally positioned himself as a centrist New Democrat, a moderate on social and economic issues; and both he and his vice president, Al Gore, were from the culturally conservative South. Yet Clinton's personal behavior and, in many cases, policy positions alienated cultural conservatives, strengthening the Republican party in regions where cultural conservatism predominates. The power of this dimension was exemplified by Al Gore's failure to win either his home state of Tennessee or Clinton's, Arkansas, both of which fall on the Republican side of the widening regional and cultural divide.
Partisan Polarization
The close partisan balance in the electorate left both parties competing for moderate and independent voters in states and districts where the partisan balance was equal enough to foster genuine competition. As a consequence, the campaigns that would decide which party would control the House and Senate tended to downplay party, because moderate swing voters are thought to detest partisan squabbling. The same was true of the presidential campaigns. Thus it was not until after the election that the intense partisan polarization that characterized national politics during the Clinton years came into sharp relief once again. When it did, reactions to the postelection action in Florida confirmed that not only politicians and activists, but also ordinary Americans have become sharply divided along party lines.
Members of Congress and partisan activists immediately rallied to their party's presidential candidate. Both the heated rhetoric and clean partisan split were reminiscent of the struggle over Clinton's impeachment, which had divided members of Congress almost perfectly along party lines. 24 "They're stealing it, they're stealing it, they're stealing it" is how Republican Representative Charles W. Pickering, Jr. of Mississippi put it, unprompted, to a reporter. 25 Like impeachment politics, the instinctive partisan reactions to postelection events in Florida showed just how polarized national politics has become.
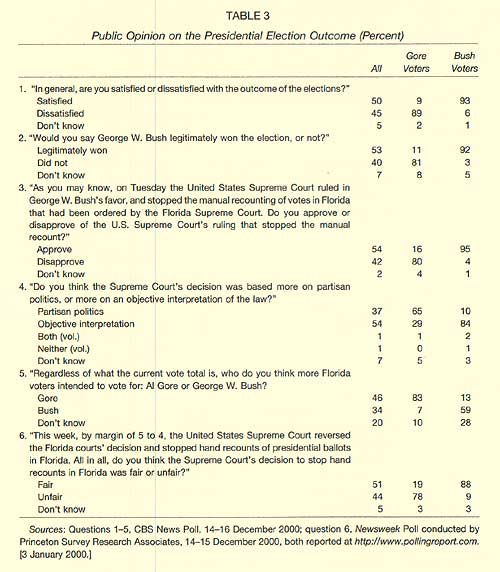
The split was not confined to politicians and activists; although ordinary voters were more bemused by than passionately involved in the postelection events in Florida, they, too, divided strongly along party lines in responding to questions. Polls assessing public opinion on the election's aftermath found immediate, sustained, and huge differences between Bush and Gore supporters (that is also to say, between Republicans and Democrats 26 ) on relevant questions. Some examples appear in Table 3. Among Bush voters, 93 percent were satisfied with the election outcome, 92 percent thought Bush had won the election legitimately, and 95 percent approved of the Supreme Court's decision stopping the manual recount of ballots in Florida. Among Gore voters, 89 percent were dissatisfied with the outcome, 81 percent thought Bush was not the legitimate victor, and 80 percent disapproved of the Supreme Court's decision. Most Gore supporters (65 percent) thought the Court's decision was partisan, while most Bush supporters (84 percent) thought it was impartial. Gore voters were convinced that more Florida voters intended to vote for Gore than for Bush (83 percent), while most Bush voters believed the opposite (59 percent, with another 28 percent uncertain). The two sides were also sharply divided on whether the Court's decision to stop the vote count was fair. Partisan differences of this magnitude are unusual in public opinion data, but they are fully consistent with evidence of increasing partisan polarization among voters both before and during the Clinton administration. They echo the split between self-identified Democrats and Republicans over Clinton's impeachment, when polls consistently found about 85 percent of Democrats opposed to impeaching and convicting the president, and about 65 percent of Republicans in favor. 27
Partisan divisions among both members of Congress and ordinary citizens have been growing for several decades. The widening partisan and ideological divide in Congress has been thoroughly documented. 28 It is summarized in Figure 6, which displays changes over time in House members' average Poole-Rosenthal DW-Nominate scores. DW-Nominate scores are calculated from all nonunanimous roll call votes cast during the 80th through 105th Congresses and locate each member for each Congress on a liberal-conservative scale that ranges from −1.0 to 1.0; the higher the score, the more conservative the member. 29
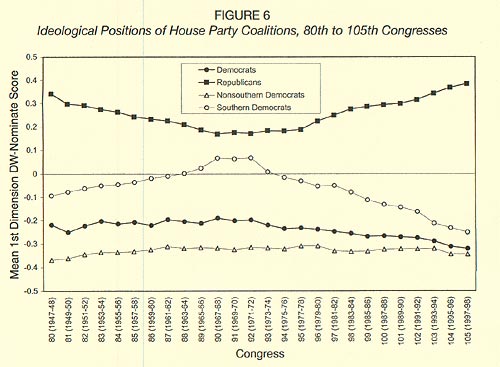
The mean ideological locations of House Republicans and Democrats converged from the 80th through 90th Congresses, then began to diverge steadily. By the 105th Congress, the gap between the parties' mean locations exceeded 0.71 on this 2-point scale, about twice what it was in the early 1970s. Figure 6 provides more detail on the etiology of the trend: the Republican mean moved to the right, while the Democrat mean moved to the left, a consequence, plainly, of the gradual atrophy of the party's conservative southern wing. As the parties pulled apart ideologically, they also became more homogenous internally; by the 105th Congress, the House contained the most distinctive and polarized party coalitions in more than fifty years. 30 The same trends appear among senators as well. 31
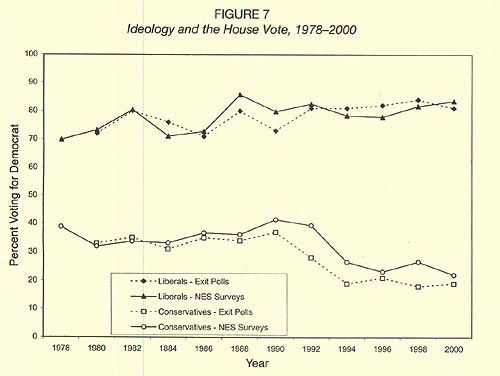
These trends are familiar to observers of Congress. Less widely known is that voters also became increasingly polarized along ideological and partisan lines during the same period. The proportion of voters placing themselves to the right or left of center on the National Election Studies 7-point ideological scale has grown since the 1970s, and the relationships between party identification, ideology, and voting behavior have all become stronger. 32 In particular, the connection between ideology and House voting has strengthened in the 1990s. As Figure 6 shows, the main reason is that self-identified conservatives have become much more likely to vote for Republican House candidates in the 1990s.
The growing partisan and ideological coherence, consistency, and loyalty among voters reinforce partisan polarization in Congress, for they make House Republican and Democratic electoral constituencies--defined as the voters who support each party's successful congressional candidates--more homogeneous and more dissimilar. Between 1972 and 1998, for example, the gap between the average ideological self-placement of the respective House parties' electoral constituents doubled. Republicans' supporters were responsible for the lion's share of the change; even as the Republicans' electoral constituency was expanding at the expense of the Democrats, it was becoming more uniformly conservative. 33
The widening gap between the congressional parties' respective electoral coalitions also shows up in aggregate electoral data. In 1972, the average Democratic member's House district was less than eight percentage points more Democratic in its presidential vote than the average Republican's district; by 1996, the gap had grown to more than sixteen percentage points. District-level presidential vote data are not yet available for 2000, but substituting Clinton's 1996 vote suggests that the gap between the House parties' respective electoral coalitions is at least as large for the 107th Congress as it was for the 105th. The congressional parties have moved apart as their electoral constituencies have moved apart.
It is no coincidence that partisan and ideological polarization reached postwar highs during the Clinton administration. Clinton has been a polarizing figure in American politics since his first appearance on the national scene during his campaign for the nomination in 1992. Socially conservative Republicans associated with the religious Right took a deep dislike to him from day one, viewing him as a pot-smoking, draft-dodging, womanizing liberal, who was fundamentally mendacious, conniving, and morally unfit to be president. They never saw fit to reconsider. 34 Other Republicans have also generally taken a dim view of his morals, even while approving of his administration's performance on the economy, budget deficit, and other aspects of policy. Some Democratic constituencies, particularly African Americans, have been enthusiastic supporters; other Democrats have rallied to him because, whatever they think of Clinton, they loathe his many enemies on the Right even more. The signal events of his presidency--the fights over gays in the military, the national health system in 1993-1994, the showdown with the Republican Congress over the budget in 1995, and, above all, the impeachment struggle in 1998-1999--uniformly served to reinforce partisan and ideological divisions.
Clinton's capacity to divide both the Congress and the electorate along party lines was on fullest display during his impeachment and Senate trial, but it was also evident throughout his presidency. Congressional party differences in level of support for presidential initiatives were greater during his administration than in any since Congressional Quarterly first began publishing this information. 35 The average party difference during the Clinton years of 45 percentage points was more than 10 points larger than that in any administration from Eisenhower through the first Bush presidency. Still, this fissure began to widen well before Clinton. Party differences in presidential support have generally been growing wider since the Nixon administration. Once again, the Clinton years witnessed not the initiation but rather extension of a preexisting trend. The opposition party is responsible for nearly all of the change, as its level of support for the president has declined while support from members of the president's party has remained stable.
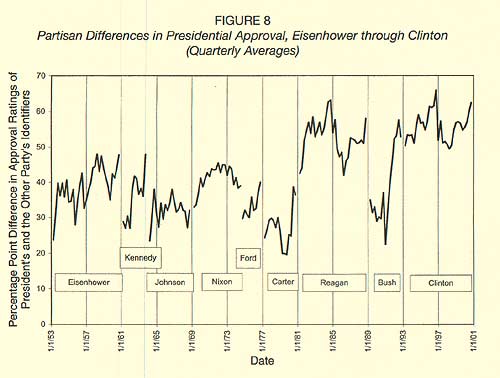
The public displays a complementary trend in its responses to the Gallup Poll's presidential approval question during the same period. Differences in level of approval between respondents identifying with the president's and those identifying with the other party from Eisenhower through Clinton are displayed in Figure 8. Again, the gap is widest during the Clinton administration (averaging 56 percentage points). The Reagan administration is not far behind (53 points), however, indicating that wide partisan divisions in evaluations of presidents predate Clinton. By this evidence, Reagan too was a polarizing figure, most likely because of the intense partisan conflicts over the federal budget during his administration. As with presidential support in Congress, the widening partisan gap in presidential approval is largely a consequence of declining levels of approval by people who identify with the opposition party.
Outlook for the 107th Congress
It is not surprising that both members of Congress and ordinary voters divided reflexively into separate partisan camps in response to the postelection dispute over Florida's votes. In the context of the political trends reviewed in this article, it would have been remarkable only if they had not done so. The way in which George W. Bush won the White House certainly makes it harder for him to deliver on his campaign promise to "be a uniter, not a divider." But even without that burden, any president would face a formidable challenge in trying to govern in harness with a Congress so evenly and sharply divided by party as the one elected in 2000, especially when the partisan divisions are so firmly rooted in the parties' respective electoral constituencies.
Bush might take some hope from the example of his father. Observe in Figure 8 that party differences in presidential approval were relatively small during the first three years of the senior Bush's presidency, mainly because his approval rating among Democrats remained relatively high. During the same period, party divisions in Congress over Bush's legislative agenda were smaller than was typical for Reagan or Clinton. Not until 1992, do the data show partisan differences matching those of the Reagan and Clinton years.
Unfortunately for George W. Bush, political conditions make it much more difficult for him to attract moderate Democrats with his "compassionate conservatism" than it was for his father with talk of a "kinder, gentler nation." The father dealt with Democratic congressional majorities that were responsible for governing and were confident they would retain power for the foreseeable future; the son must deal with a closely divided Congress, where every action will be taken with an eye to maintaining or gaining control in the next election. Bush has to bridge a much wider ideological divide than did his father, and not only between the parties. Not the least of his challenges will come from the staunch conservatives who dominate his party's congressional wing; after six years of being stymied and out-maneuvered by Clinton, they are scarcely in the mood for bipartisan compromises. But to the extent that Bush sides with his party's conservatives in Congress, Democrats will be attracted to the strategy of take-no-prisoners opposition pursued so successfully by congressional Republicans in 1993-1994.
Finally, unless he is extraordinarily lucky, Bush cannot expect help from the kinds of global events that buoyed his father for the first three years of his administration. The senior Bush got to preside over the demise of the Berlin Wall, the end of the cold war, and victory in the Gulf War, successes that drove his approval ratings to record highs. 36 Such opportunities are unusual, and none appear at present on the horizon. Moreover, the economy, which was his father's downfall, is showing ominous signs that the longest expansion in U.S. history may be ending just as Bush takes office.
Under these conditions, the political configuration left in place by the 2000 elections is likely to continue the pattern of contentious partisan conflict in which gridlock and stalemate prevail most of the time. If that happens, politicians' energies will turn to persuading voters to break the deadlock by settling matters in their favor in 2002 and 2004.
Looking Forward to 2002
Both houses of Congress will be up for grabs once again in 2002. The Democrats' quest for the Senate might appear to be favored by the subset of seats that are up for election; Democrats currently hold only fourteen of them, while the Republicans must defend twenty-one. However, only five of the current Republican seats are in states won by Gore, and Democrats have to defend three seats in states won by Bush. Democrats may actually have a better chance to take over the Senate before the 2002 elections. Republican control rests on the continued health of the 98-year-old Strom Thurmond of South Carolina and the 79-year-old Jesse Helms of North Carolina. Each represents a state with a Democratic governor who will appoint his successor if he cannot serve out his term.
Even if no change in voters' sentiments occurs, the partisan balance in the House may be altered by the reapportionment and redistricting that must take place before the 2002 midterm in accordance with the 2000 census. Redistricting after the 1990 census clearly benefited the Republicans, because the states that gained seats in the House were significantly more Republican than the states that lost them. In addition, the federal Voting Rights Act's charge to the states to design districts that are winnable by minority candidates worked as a pro-Republican gerrymander. 37 The post-1990 reapportionment and redistricting were a major reason why Republicans finally gained control of the House in 1994. 38
Republicans should also benefit from the post-2000 reapportionment and redistricting. As in the 1990s, the states scheduled to gain seats are more Republican (as measured by the presidential vote) than the states that will lose seats. Gore won six of the ten states losing seats, while Bush won seven of the eight states gaining seats. 39 Moreover, Republican governors and legislatures will control the redistricting process in a slightly larger number of the states where extensive changes in district lines are likely to be required. Republicans also will benefit from Democratic retirements if those members who were persuaded by Minority Leader Richard Gephardt to run one more time in order to help their party retake the House in 2000 now decide to step down. 40
House Democrats' main hopes for 2002 lie in Bush's victory in 2000. With the exceptions of 1934 and 1998, the president's party has lost House seats in every midterm election since the Civil War. During the past half-century, the Republicans have lost an average of twenty-four House seats in each of the seven midterm elections held during Republican administrations. The main reason that the Republicans did poorly in these elections was the economy. Four of them were held in recession years, two others in years of feeble economic growth, and only one in a year when the growth rate was even average (1986). Republicans lost an average of thirty-five seats in the recession years, compared with eight in the others.
The battle for control of the House in 2002 is likely to be determined mainly by the Bush administration's performance in managing the economy. If the economy continues to grow or bounces back quickly from any slowdown and Bush maintains decent public approval ratings, redistricting may offset the usual midterm decline sustained by the president's party and the Republicans may hold on. But if history is any guide, the 2002 elections offer Democrats their best chance of retaking the Congress since they lost it in 1994.
Endnotes
Note 1: "Final Vote Tally Shows 105 Million Voted," Los Angeles Times, 19 December 2000. Back
Note 2: The two remaining members are independents who split on which party they routinely support. Back
Note 3: Gary C. Jacobson, The Politics of Congressional Elections, 5th ed. (New York: Addison Wesley Longman, 2001), 106-107; Alan I. Abramowitz, "The End of the Democratic Era? 1994 and the Future of Congressional Election Research," Political Research Quarterly 48 (December 1995): 873-889; Warren E. Miller and J. Merrill Shanks, The New American Voter (Cambridge, MA: Harvard University Press, 1996), chap. 7. Back
Note 4: In twenty Gallup Polls taken between January and September 2000, the Democrats averaged 51.5 percent of the major-party identifiers (with leaners included among the partisans). Back
Note 5: Jacobson, Politics of Congressional Elections, 178-194. Back
Note 6: The data on presidential approval are from CBS News/New York Times and Gallup polls; the data on congressional approval are from CBS News/New York Times, Gallup, NBC/Washington Post, ABC/Wall Street Journal, CNN/Time, and Los Angeles Times polls, all at http://www.pollingreport.com. Back
Note 7: The congressional approval question was not asked during the second quarter of 1994, so I interpolated the data point for that quarter. Back
Note 8: Gary C. Jacobson and Samuel Kernell, Strategy and Choice in Congressional Elections, 2nd ed. (New Haven: Yale University Press, 1983), chap. 3. Back
Note 9: Three other incumbents, two Democrats and a Republican, lost primary elections. Back
Note 10: Gary C. Jacobson, "Congress: Elections and Stalemate" in Michael Nelson, The Election of 2000 (Washington, DC: Congressional Quarterly Press, 2001), forthcoming. Back
Note 11: Gary C. Jacobson, "Public Opinion and the Impeachment of Bill Clinton," British Elections and Parties Review 10 (2000), forthcoming. Back
Note 12: Bob Benenson, "Proudly Worn Party Label Missing in Key Contests," Congressional Quarterly Weekly Report, 22 September 2000, 2182-2185. Back
Note 13: Andrew Taylor, "Sound Like a Moderate, Vote Like a Conservative," Congressional Quarterly Weekly Report, 5 August 2000, 1930-1934; Mike Christensen, "Congress' Cornucopia: A Sampler of Spending Add-Ons," Congressional Quarterly Weekly Report, 7 October 2000, 2322-2323. Back
Note 14: This procedure is, of course, premised on my argument that the parties enjoy rough parity in the electorate; but any reasonable procedure for making these comparisons across time would show a comparable pattern. Back
Note 15: Gary C. Jacobson, "The 1994 House Elections in Perspective," Political Science Quarterly 111 (Summer 1996): 203-223. Back
Note 16: Alan I. Abramowitz and Kyle L. Saunders, "Ideological Realignment in the U.S. Electorate," Journal of Politics 60 (August 1998): 639-642. Back
Note 17: But only on average; reelection rates of senators vary widely from year to year, ranging in post-World War II elections from a high of 97 percent in 1990 to a low of 55 percent in 1980. Back
Note 18: Mark C. Westlye, Senate Elections and Campaign Intensity (Baltimore: Johns Hopkins University Press, 1991), 25. Back
Note 19: In at least one instance, a presidential campaign gave decisive help to a Senate candidate: the huge effort to get out the union and minority vote that swung Michigan into the Gore column was essential to Debbie Stabenow's victory over Spencer Abraham. See "Michigan," New York Times, 9 November 2000. Back
Note 20: The South includes Alabama, Arkansas, Florida, Georgia, Kentucky, Louisiana, Mississippi, North Carolina, Oklahoma, South Carolina, Tennessee, Texas, and Virginia; the Plains include Kansas, Nebraska, North Dakota, and South Dakota; the Mountain West includes Alaska, Arizona, Colorado, Idaho, Montana, Nevada, New Mexico, Utah, and Wyoming. Back
Note 21: The Northeast includes Connecticut, Delaware, Maine, Maryland, Massachusetts, New Hampshire, New Jersey, New York, Pennsylvania, Rhode Island, and Vermont; the Midwest includes Illinois, Indiana, Iowa, Michigan, Minnesota, Missouri, Ohio, Wisconsin, and West Virginia; the West Coast includes California, Hawaii, Oregon, and Washington. I have placed Alaska in the Mountain West because it has far more in common--geographically, culturally, and politically--with the Mountain states than with the West Coast states. Back
Note 22: Figures 4 and 5 show how much the share of votes cast for Republican House candidates deviated from 50 percent for each category of respondents. Back
Note 23: Gary C. Jacobson, "The Elections of 2000 and Beyond," A Supplement to Gary C. Jacobson and Samuel Kernell, The Logic of American Politics (Washington, DC: Congressional Quarterly Press, 2000), 23-25. Back
Note 24: In the House, 98 percent of the Republicans had voted for at least one of the four articles of impeachment, and 98 percent of the Democrats had voted against every one of them. In the Senate, 91 percent of the Republicans voted to convict Clinton on at least one article, while not a single Democrat voted for conviction on any article. Back
Note 25: Andrew Taylor, "First Test of Promised Comity is Late Lame-Duck Session," Congressional Quarterly Weekly Report, 18 November 2000, 2723. Back
Note 26: Polls that report responses broken down by party identification rather than presidential preference replicate the results reported in Table 3. For example, a Gallup Poll taken 15-17 December found 85 percent of Republicans saying that Bush won "fair and square," while 49 percent of Democrats thought he had won on a technicality, and 37 percent said he stole the election. See http://www.gallup.com/poll/release/pr001220.asp. [28 December 2000.] Back
Note 27: Jacobson, "Public Opinion and Impeachment." Back
Note 28: John Aldrich, Why Parties? The Origin and Transformation of Party Politics in America (Chicago: University of Chicago Press, 1995), chap. 7; David W. Rohde, Parties and Leaders in the Post-Reform House (Chicago: University of Chicago Press, 1991), chaps. 3 and 5; Barbara Sinclair, "Hostile Partners: The President, Congress, and Lawmaking in the Partisan 1990s" in Jon R. Bond and Richard Fleisher, Polarized Politics: Congress and the President in a Partisan Era (Washington, DC: Congressional Quarterly Press, 2000), 137-140; Gary C. Jacobson, "Party Polarization in National Politics: The Electoral Connection" in Bond and Fleisher, Polarized Politics, 9-15; Nolan McCarty, Keith T. Poole, and Howard Rosenthal, Income Redistribution and the Realignment of American Politics (Washington, DC: American Enterprise Institute, 1997), chaps. 2 and 3; Richard Fleisher and Jon R. Bond, "The President in a More Partisan Arena," Political Research Quarterly 49 (December 1996): 729-48. Back
Note 29: For an explanation of the methodology for computing these scores and justification for their interpretation as measure of liberal-conservative ideology, see Keith T. Poole and Howard Rosenthal, Congress: A Political-Economic History of Roll Call Voting (New York: Oxford University Press, 1997), chaps. 3 and 10; DW-Nominate Scores are updated versions of their D-Nominate measure. Back
Note 30: Gary C. Jacobson, "The Electoral Basis of Partisan Polarization in Congress" (paper presented at the Annual Meeting of the American Political Science Association, Washington, DC, 31 August-3 September 2000), 1-2. Back
Note 31: McCarty, Poole, and Rosenthal, Income Distribution and Realignment, 16. Back
Note 32: Jacobson, "Electoral Basis of Partisan Polarization," 6-7. Back
Note 34: Conservative political columnist George Will, for example, ended his wrap-up on the Clinton administration with this sentiment: "Clinton is not the worse president the republic has had, but he is the worst person ever to have been president"; see "Clinton's Mark," Washington Post, 11 January 2001. Back
Note 35: The same trend appears in both the House and Senate. Back
Note 36: George C. Edwards III, "George Bush and the Public Presidency: The Politics of Inclusion" in Colin Campbell, S.J. and Bert A. Rockman, The Bush Presidency: First Appraisals (Chatham, NJ: Chatham House, 1991), 136-138. Back
Note 37: Minority voters are primarily Democrats; packing them into minority-majority districts thus makes neighboring districts more Republican. See Gary C. Jacobson, The Politics of Congressional Elections (New York: Addison Wesley Longman, 2001), 10. Back
Note 38: Gary C. Jacobson, "Reversal of Fortune: The Transformation of U.S. House Elections in the 1990s" in David Brady, John Cogan, and Morris P. Fiorina, Continuity and Change in Congressional Elections (Stanford: Stanford University Press, 2000), 11-12. Back
Note 39: Arizona, Texas, Florida, and Georgia gain two seats each; California, Colorado, Nevada, and North Carolina gain one each; New York and Pennsylvania lose two each; Connecticut, Illinois, Indiana, Michigan, Mississippi, Ohio, Oklahoma, and Wisconsin lose one each. Back
Note 40: Karen Foerstel, "Gephardt's Charge," Congressional Quarterly Weekly Report, 4 November 2000, 2578. Back