|
|
|
|

The OECD Observer
January 1999, No. 215
Understanding Development Needs
By Brian Hammond
In the first of a series on development, we take a brief look at the problems of assessing and measuring development needs.
In 1996 ministers and heads of aid agencies set out a vision for development co-operation which included achieving a limited number of goals by 2015. In February 1998, the OECD Development Assistance Committee, together with the UN, the World Bank and developing country partners, agreed on a working set of core indicators to measure progress towards these goals.
Identifying and selecting a common set of indicators is an important step towards enhanced development performance, though only as part of a coherent policy-driven process. Indicators can provide a yardstick to assess needs on a comparable basis across countries. They show some positive historical trends. For example, taking all 171 developing countries and countries in transition as a group over the past 20 years: average family size has declined from 4.7 children to 3; 10% more children are attending primary school; three people in five have access to safe water, up from two in five; and infant mortality has fallen from one in ten to one in 16.
Gathering comparable data is one problem. Presenting them in a meaningful and useful way poses a number of difficulties. One method of assessing needs is to plot one or more of the indicators on world maps (see map). While this graphically shows where the needs are greatest, it allows analysis of only one dimension of development at a time.
Another method is to group countries by combining a number of dimensions of development. The United Nations Development Programme does this in its annual Human Development Report by use of the Human Development Index. This index is a composite of life expectancy, educational attainment and GDP per capita (in dollars at purchasing power parities). Rather than calculating individual ranks (scores) for each country, an alternative approach adopted for this set of core indicators is to place countries in five equal-sized groups (quintiles) by combining their relative ranking on a selection of indicators related to the selected goals. (See the Development Indicators Web site, http://www.oecd.org/dac/indicators, to see the goals and indicators selected, which countries are in which quintile, the indicators used to group the countries, and the latest data for the indicators in the core set.) This approach provides a proxy for measuring a country’s distance from the goals. The precise distance cannot be measured for two reasons. First, the goals are global ones and individual countries will set the goals that suit their own circumstances; and second, a number of the goals are relative, for example, two-thirds cut in child mortality, and so for the baseline year all countries are, by definition, equidistant from them.
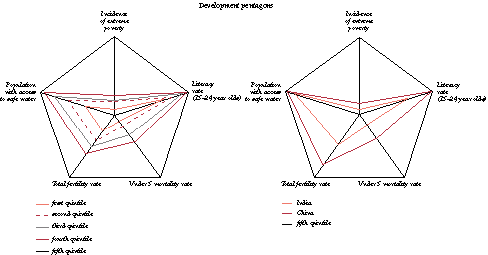
The results are best shown by use of development pentagons which indicate the relative performance of each group of 34 countries on a selection of indicators (see chart). The outer line reflects the levels for the highest group, which are roughly equivalent to levels in developed countries. A pentagon is shown for each of the lower groups. The further they are on each axis from the outer pentagon, the greater the progress that that group needs to make on that dimension to reach developed country levels.

Thus the groups highlight disparities in levels of development. On poverty, for example, the lower groups are a long way from the outer line, reflecting the fact that much higher percentages of the population in these groups live in poverty. On literacy, by contrast, the lower groups are much closer to the outer line, because literacy is more evenly distributed among the country groups.
For the 34 countries in the first group, the most recent data covering 1990-95 shows: nearly 40% of the population live in extreme poverty; less than half the children go to school (and of these only seven girls for every ten boys); women have an average of six children, one of whom is likely to die before its fifth birthday; and two-thirds of the people lack access to safe water.
Such stark facts show the value of the key indicators to demonstrate the needs of this group of countries, many of which are further burdened by current or recent conflict which inhibits providing effective assistance for long-term development.
OECD Bibliography
Development Co-operation Report, 1997.
(http://www.oecd.org/scripts/publications/bookshop/redirect.asp?431998011P1)