|
|
|
|

The OECD Observer
October/November 1998, No. 214
OECD taxes revisited
By Steven Clark and Flip de Kam
Governments claim over a third of the annual output of the OECD area to finance their spending. This overall level of taxation hides enormous variations in the structure of national tax systems and the bills taxpayers in OECD countries face. Those intent on reform need to understand the economic effects of these different taxes, particularly in this time of increasing tax mobility.
The current weight of taxes, their role in financing state spending and their intricate interplay with economic processes make them a central issue for governments and taxpayers alike. Every year, the OECD publishes two reports to assist policy-makers and other interested parties in monitoring tax trends. Revenue Statistics presents detailed, internationally comparable data on the tax revenues of OECD countries for all strata of government and a wide range of tax bases, including contributions to finance publicly-run social security and health programmes. The Tax/Benefit Position of Employees supplements this coverage by reporting the personal income tax and social-security contributions paid by employees and employers, measured by their impact on ordinary households. The study also compares the cash benefits received by families with children. The resulting figures, which include calculations of average and marginal tax rates, show the net impact of taxes and benefits for households at different wage rates and under alternative assumptions of family size.
The data presented in Revenue Statistics reveal that over the past thirty years the average tax burden—including social-security contributions—has risen in nearly every OECD country, though at varying speeds. Between 1965 and 1996, in Canada, Mexico and the United States the tax-take from GDP inched up from an (unweighted) average of 25% to 27%. In OECD Europe, by contrast, the overall tax/GDP ratio increased from 27% to 40%. In Australia, Japan and New Zealand, the corresponding figure expanded from 22% to 30% of GDP.
Data from individual countries show considerable variation in the national tax burden and its evolution (Table 1). In the European region, for example, in five countries—Belgium, Denmark, Finland, France and Sweden—the tax burden in 1996 exceeded 45% of GDP. In contrast, Mexico’s total tax revenues were only 16% of GDP, and four countries—Japan, Korea, Turkey and the United States—had tax burdens in the 20-30% range.
Liberalisation, globalisation and the ‘tax mix’
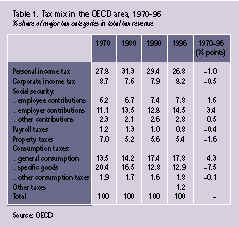
A firm grasp of the differences in national ‘tax mixes’—the share of separate types of taxes in total tax revenues—and a good understanding of their potential implications is crucial to effective policy making. Over the past 30 years the tax mix has been remarkably stable. Nevertheless, several trends have emerged.
Liberalisation and globalisation may have led to improved resource allocation and prosperity around the world, but they have also widened opportunities for tax evasion and avoidance, with income from profits, interest and dividends showing itself to be a particularly mobile tax base. Increasingly, countries, such as the Netherlands, which set relatively high tax rates on capital income, run the risk of seeing a growing part of their revenue base evaporate as firms and private investors shift profit and other investment income to countries with lower tax regimes. And as that income tax base becomes more mobile, governments will be forced to rely more heavily on taxes imposed on labour, consumption and other less-mobile activities to finance their outlays. Such developments tend to make tax systems less equitable because the resulting growing share in the mix of regressive taxes places a disproportionate burden on people with lower incomes. Moreover, the shift to less mobile tax bases may lead to new tax-induced distortions. For example, higher taxes on labour would discriminate against jobs, with the risk of driving up unemployment or fuelling illegal labour markets.
Recent changes in the tax mix in OECD countries give some evidence that these effects of liberalisation and globalisation are already being felt. Although taxes on income and profits (which are relatively mobile tax bases) remain the largest source of revenue—35% of the total tax revenues for OECD countries taken as a whole—their role gradually declined during the first half of the 1990s (Table 1). This decline was matched by the growing weight of consumption taxes (which in 1996 yielded over 32% of total revenue) and of social-security contributions (25%), which may well be explained by growing difficulties encountered by authorities in taxing income from capital. Consumption taxes are already the single most important source of revenue in nine OECD countries—Greece, Hungary, Iceland, Korea, Mexico, Norway, Poland, Portugal and Turkey.
The ability of OECD countries to continue raising revenue from capital income, and in particular from corporate profits, will thus be of considerable importance. New forms of international co-operation in this area may be required to counter tax planning and tax avoidance. To this end, in April the OECD Council approved a report prepared by the OECD Committee on Fiscal Affairs which makes 19 wide-ranging recommendations to counteract the distorting effects of harmful tax practices in the form of tax havens and harmful preferential tax regimes around the world. The report focuses on geographically mobile activities, such as financial and other service activities. (Harmful Tax Competition. An Emerging Global Issue, OECD Publications, Paris, 1998.)
Bismarck versus Beveridge
Over the past quarter-century unemployment rates have more than doubled in many OECD countries, particularly in Europe. Reduced employment opportunities are partly reflected in the growing take-up of disability and early-retirement programmes (which are tantamount to ‘hidden unemployment’). (See Sveinbjörn Blöndal and Stefano Scarpetta, ‘Retire Early, Stay at Work?’, The OECD Observer, No. 212, June/July 1998 (http://www.oecd.org/publications/observer/212/Article4-eng.htm).) In addition, as larger segments of the population have reached retirement age, spending on old-age pensions has risen substantially. Moreover, the costs of health care—often publicly financed—have proved very difficult to contain, as higher demand, ageing populations and increased access to new and more expensive medical services and products have driven up spending. Together, these trends largely explain the higher share of social-security contributions in the tax mix of a range of OECD countries.
In six countries—Austria, the Czech Republic, France, Germany, the Netherlands and Spain—social-security contributions are now the main source of general government revenue. The dominant role of such contributions in these countries stems directly from the so-called Bismarck model which remains the foundation of the social-security system in much of Europe today. The model sees government-provided social security as a special form of insurance, with both benefits and contributions linked to the wages of workers. In a number of countries the contributions are channelled through separate funds which are kept apart from the budget of central government. By contrast, in systems inspired by the Beveridge model found in most English-speaking countries almost all or a substantial part of public spending on social security tends to be financed from the central budget.
Income taxes and redistribution
Consumption taxes and social-security contributions have flat rates. Although lower rates of value-added tax usually apply to basic necessities, consumption taxes disproportionately hit lower-income households, which consume a larger part of their disposable income. Social-security contributions are often capped in that they are levied on income below a certain ceiling. This makes such taxes regressive. Generally, countries tax corporate profits at flat rates too.
In contrast, the structure of the personal income-tax rates is progressive everywhere, meaning that as taxable income rises, the fisc claims an increasingly bigger share. It follows that in countries where the personal income tax supplies the larger part of the revenue, the tax system tends to bring about more redistribution of income. Taxes on personal and corporate income are the main source of revenues used to finance government spending in fourteen OECD countries, and in five of them—Australia, Canada, Denmark, New Zealand and the United States—their share in the tax mix exceeds 45%. In OECD countries where regressive taxes predominate, such as France, Germany and the Netherlands, the overall redistribution of personal income by government may nevertheless be more effective because the size and targeting of transfers outweigh any regressive tax effects.
Between 1960 and 1996, despite increased opportunities for shifting some types of personal income offshore and an overall drop in its share in the tax mix, revenues from personal income tax still rose as a percentage of GDP. They almost doubled from 6.8% to 12.3% of GDP in OECD America. In the OECD Pacific region, they rose from 7.2% to 9.6% of total output. Similar figures of 7.0% in 1995 and 10.4% in 1996, are observed for OECD Europe.
In the same period revenue from taxes on corporate income fell substantially in OECD America, from 3.9% to 3.0% of GDP. In OECD Pacific, the percentage fell slightly, to 3.9%; in OECD Europe, it increased from 1.7% to 2.9%. But these unweighted averages tell only part of the story. In France, for example, corporate-tax revenues fell slightly, from 1.8% to 1.7% of GDP. Germany witnessed a much larger drop, from 2.5% to 1.4%. In contrast, the United Kingdom saw its corporate-tax revenues increase, from 2.2% to 3.8% of GDP. They rose also in the Netherlands, and more than doubled in Luxembourg, from 3.1% to 7.2%.
These different trends are the outcome of an amalgam of sometimes conflicting factors. One is that many OECD countries have integrated their personal and corporate tax systems to avoid double taxation of income from capital organised in corporate form. Adjustments to these systems, including the degree to which income taxes are integrated, can result in shifts between the taxation measured on personal and corporate incomes. Tax revenues from corporate income will also be a function of the ability of a country to attract inbound investment—and to discourage outbound investment—which will in part reflect the influence of tax incentives available to corporations or shareholders.
Why visibility matters
Taxes on income, property and net wealth are highly visible if they are levied by annual assessment, which is usually the case. In contrast, taxes and contributions directly paid by firms and employers, or withheld from gross wages and consumption taxes that are not explicitly included in sales prices, are generally less visible to taxpayers. Some might argue that a relatively large share of income, property and wealth taxes in a tax mix will tend to encourage taxpayer resistance, with voters inclined to press for lower taxation and less government spending. Country data on the share of ‘visible’ taxes in the mix and the overall volume of public spending offer some evidence in support of this view, as with Australia, Japan and the United States.
But there are exceptions, like Denmark, where social security forms part of the central budget. The explanation may be that voters in a number of countries are used to, and actually demand, government spending on such visible benefits as health and education, and are willing to pay a higher ‘tax price’ to obtain them. But a high price does not mean any price. Most voters probably prefer relatively generous government provision of goods, social benefits and income transfers, but are reluctant about paying the taxes required to fund them. They tend to accept the corresponding tax burden when it is at least perceived as being relatively modest. If this line of reasoning has any merit, then making taxes ‘invisible’ will attract policy-makers keen on shoring up or expanding the public sector in the economy without upsetting the electorate. However, being economical with the fiscal truth in this way may only build up pressure for future reform.
Employee contributions
OECD countries differ strongly in the part of social-security spending they finance from earmarked contributions, but also in the wide variety of contributions from employees and employers. Employee contributions combine with income tax to explain the gap between gross and net wage earnings (Table 2).
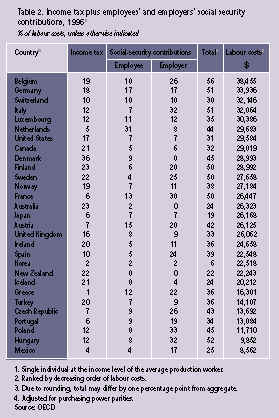
In 1996, for unmarried workers at average earnings in Belgium, Denmark and Germany, payments of personal income tax and employee social-security contributions claimed more than 40% of annual gross wages; in Greece, Japan, Korea, Mexico, Poland and Portugal, this figure was under 20%. For one-earner couples with two dependent children, the gap between gross wage-earnings and net take-home pay is generally smaller. Greece (where employers pay higher wages to bread-winners), Mexico and Turkey are exceptions here. And in Iceland, when cash benefits for children are taken into account, the net transfer becomes positive, which means that transfers received exceed taxes paid, resulting in a net payment to the household.
Employer contributions
In most OECD countries, employers contribute substantially to financing the social-security system, with their total labour costs being determined by workers’ gross wage-earnings plus social-security contributions made by employers themselves. It follows that workers ‘earn’ substantially higher wages than they are aware of, because as a rule employers’ social-security contributions do not figure on pay slips. Most pay slips show the amount of the gross wage, which is the total labour cost minus the employer’s social-security contributions, and the net wage, or take-home pay, which is the gross wage less taxes and other obligatory state deductions.
In 1996 the wedge between total labour costs to the employer and net take-home pay to workers, at average earnings, ranged from a low 6% of labour costs in Korea and 19% in Japan, to 52% in Hungary and 56% in Belgium. Differences in tax/GDP ratios and the varying share of personal income tax and social-security contributions in national tax mixes go far to explain the wide variation in the size and make-up of tax wedges in OECD countries.
In Greece and Korea employees at average earnings pay hardly any income tax (1% and 2% respectively); in Denmark, by contrast, they pay 36%. Employees’ contributions to social security also vary widely, ranging from 0% in Iceland, New Zealand and Poland to 31% in the Netherlands. Employers, on the other hand, pay 33% in social-security contributions in Poland, 32% in Hungary and Italy, and 30% in France, while employers in Australia, Denmark and New Zealand are not subject to such levies at all.
Taxation at the margin
Average tax rates show the part of labour costs or gross wages, respectively, absorbed by taxes and contributions. Often, workers will hardly be aware of this tax take and instead will tend to focus on the net wage they receive. In some cases, for example, when workers consider whether it pays to do over-time, or to invest that time and other resources in training and education in the expectation of higher future wages, they may be interested in knowing by how much their gross wage earnings might increase, but they will particularly want to know how much additional pay they may take home. The marginal tax rate shows how much the fisc claims from additional wages.
When gross wages rise marginally, additional personal income tax and employee social-security contributions in most cases absorb 30-50% of a worker’s pay rise. In four OECD countries—Denmark, Belgium, Finland and Germany—single workers without children earning average production-worker (APW) wages face marginal rates in the range of 50-55%. Ireland and the Netherlands impose rates that are slightly higher still. Workers in Japan (16%), Greece (20%), Poland (21%) and Mexico (22%) have the lowest marginal tax rates.
In most countries, the marginal tax rate for married one-earner couples with APW wages is the same as for single individuals without young children, or is a few points lower, although Luxembourg (29 percentage points), Ireland (21 percentage points) and France (15 percentage points) show much lower rates for married one-earner couples.
Taxes on labour income drive a wedge between what firms pay to hire labour and the pay workers take home, thus pushing up the cost to business of employing workers and discouraging part of the work-force from taking a job. Similarly, taxes influence the volume and allocation of savings and investment, which are increasingly sensitive to tax regimes. The growing mobility of whole tax bases is restricting governments’ room for manoeuvre in tax policy-making. Accurate and up-to-date information from tax statistics is of vital importance for policy analysts, both inside and outside of government. The OECD has brought to light a number of pressing developments in tax policy areas. Not least, it is clear from our tax statistics that in many countries the share of taxes with a mobile base in the national mix is shrinking. The corresponding increase in the share of consumption taxes and social-security contributions tends to discourage the input of labour to the productive process and to erode the redistributive potential of tax systems.
OECD Bibliography
Harmful Tax Competition. An Emerging Global Issue, 1998, http://www.oecd.org/daf/fa/tax_comp/taxcomp.htm
The Tax/Benefit Position of Employees, 1995-96, 1998, http://www.oecd.org/daf/fa/MATERIAL/Mat_06.htm#material_tax/benefit%20employees
Benefit Systems and Work Incentives, 1998
Sveinbjörn Blöndal and Stefano Scarpetta, ‘Retire Early, Stay at Work?’ The OECD Observer, No. 212, June/July 1998, http://www.oecd.org/publications/observer/212/Article4-eng.htm
Revenue Statistics 1965-1997, 1998.
Steven Clark and Flip de Kam: Directorate for Financial, Fiscal and Enterprise Affairs.