|
|
|
|

The OECD Observer
January 1999, No. 215
World Energy to 2020: Prospects and Challenges
By Maria Argiri and Fatih Birol
What are the key trends to expect in world energy demand and supply over the next two decades? The IEA’s projections point to some vital challenges facing governments.
There are two basic ways of looking at the future for energy demand and supply and considering their effects. One is to take a business-as-usual view (BAU) and assume that no new policies are adopted to reduce energy-related greenhouse gases. The other is to expect that the energy policies existing before the Kyoto conference of December 1997 will be adapted to tackle the issue of pollution and climate change. That Conference established a Protocol to the United Nations Framework Convention on Climate Change obliging developed countries (subject to entry into force) to reduce emissions for six greenhouse gases (GHGs) by a total of about 5% below 1990 levels by the years 2008-12. Kyoto will undoubtedly have an influence on future energy supply and demand, but to understand how, a look at the no-policy-change scenario would be useful.
Emissions will Rise Sharply Under BAU
If energy policies remain as they are today, world energy demand would grow by 65% and carbon dioxide (CO2) emissions by as much as 70% between 1995 and 2020. This sharp rise assumes a rate of world economic growth of 3.1% per year, based on 1990 US dollars adjusted for purchasing power parity. There is nothing exceptional about this growth rate, which is close to the one recorded since 1971. What is striking is that two-thirds of the increase in energy demand before 2020 will arise in China and the other developing countries. CO2 emissions under the BAU scenario are therefore expected to rise, and the rate of increase will accelerate, reflecting the stabilisation of nuclear power generation worldwide and the continued rapid growth in coal use in China and other Asian countries.
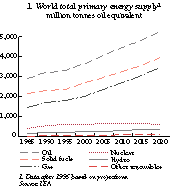
The first chart illustrates IEA projections of world energy demand by type of fuel under a business-as-usual approach. Oil continues to dominate world energy consumption, with transport use increasing its share of the total. Gas consumption rises to approach coal. Hydro-electric power and renewables rise steadily, but remain at low levels. As for nuclear power, consumption stabilises by 2020. Energy intensity, which relates energy use to growth, falls for the world as a whole, by 1.1% per year; this is because total energy use rises by 2% per year while economic activity rises by 3.1% per year. This decline in intensity follows the trend of the past 15 years.

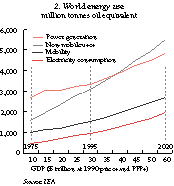
Examining demand by fuel type offers some useful hints about the future, but to analyse demand more closely, we have to look beyond fuel type and focus on four major energy uses, or so-called energy-related services. They are fuels for power generation, electricity consumption, fossil fuels used for mobility (transportation) and fossil fuels used for stationary purposes, such as space and water heating. These uses are plotted against GDP in the second chart.

Some key trends in fuel uses are important to bear in mind. For the OECD area and the world as a whole, electricity consumption and energy use for mobility closely followed the trend in economic output up to 1995. Mobility demand was largely unaffected by the 1973 and 1979 oil price shocks, although in North America it shifted a little in 1979–82, partly because of the introduction of Corporate Automobile Fuel Efficiency (CAFE) standards in the United States. Fossil fuel demand by stationary users, on the other hand, was strongly influenced by the two oil shocks. Subsequent energy-efficiency drives, a shift towards service-oriented economic activities and the relocation of some industrial activities to developing countries explain the stabilisation of fossil fuel demand for heating purposes in OECD countries as a whole since that time.
One interesting trend is that since the late 1970s, most of the rise in use of fossil fuels for heating has taken place outside the OECD. This is because the increase is driven by economic development, especially in industry, and the substitution of non-commercial traditional fuels by commercial fuels. Some energy uses become saturated as incomes increase. An example is the heating of homes and public and commercial buildings. In high-income countries, most buildings are already heated to optimum comfort levels and a 50% increase in GDP in these countries would not mean buildings heated to higher temperatures. However, if the number and size of such buildings increased, then energy use would of course rise.
After Kyoto
In the forecast period to 2020 the IEA business-as-usual model shows world demand for electricity and fuel for mobility continuing to rise. Fossil fuel demand for non-mobile uses is set to flatten out in the OECD area, but will continue upwards in China and developing countries as industrialisation rapidly increases. Energy demand by power generators will be in line with electricity demand, but growth is expected to slow as new generating plants with higher efficiency are introduced.
But what if the energy policies that existed before the Kyoto Conference were changed and new policies adopted to reduce energy-related greenhouse gases? The IEA expects future world energy use to turn out to be quite different from that described in the BAU projections, and not just because economic growth, energy prices, technology and consumer behaviour can alter over time. Most of the difference will be because the BAU scenarios are simply unacceptable, particularly in view of rising greenhouse gases. Governments in developed countries will therefore want change, as the Kyoto conference demonstrated.
It is of course not possible to prepare an accurate projection of energy demand and supply, or of CO2 emissions, without first knowing the policies to be applied and analysing their potential effects. The base for that work does not yet exist. But it is possible to get some idea of where CO2 emissions might be reduced and the types of action that would be required of energy consumers.
The IEA analysis is intended purely to illustrate the opportunities and constraints involved and is limited to the hypothesis that each OECD region seeks to meet its own Kyoto commitment in 2010. Within this constraint two analyses have been made, the first based on regulation to tackle emissions, the other on raising prices.
In the first one, called Kyoto Analysis 1, approximately half the reduction in CO2 emissions is achieved by imposing a uniform additional reduction of 1.25% per year from 1998 to 2010 in energy intensity across all sectors of final demand throughout the OECD. The other half of emission reductions is achieved by substituting fossil fuel in power generation by non-fossil fuel, whether nuclear or renewable energy.
In the second scenario, which is called Kyoto Analysis 2, instead of regulation, a uniform carbon value, or charge, is added to the price of fossil fuels in the OECD which reflects the carbon content of each fuel. The additional charge would be sufficient to achieve approximately half of the fall in CO2 emissions necessary to meet the Kyoto targets. The charge to achieve that reduction has been calculated at $250 per tonne of carbon content.
The two Kyoto analyses are quite different in their impacts. Because of different consumer reactions and dynamics, changes in fuel use under the market-based approach of Kyoto Analysis 2 vary considerably between fuels and between different energy uses. For example, throughout the OECD, electricity and fuel consumption for the purposes of mobility is much less price-sensitive than demand for fossil fuel for non-mobile uses. That means that most of the impact of the carbon value would be felt in demand for heating fuel, for example. Energy demand in North America is generally more price sensitive than elsewhere in the OECD. This is because energy prices are very low to begin with, so that any extra charge will have a higher marginal effect on the total cost.
Pricing Policies are Better
Policies aimed at achieving a uniform reduction in energy intensity across sectors and countries via regulatory action are likely to result in more welfare loss to consumers than pricing policies which are flexible and responsive to different circumstances and conditions. In other words, pricing policies are on balance more likely to achieve reductions in CO2 emissions where reductions are most needed. (The possibility of countries implementing their obligations jointly or engaging in emissions transfers or trading has not been taken into consideration in this study, which is highly aggregated by region.)
In the case of OECD North America and OECD Pacific, total power generation is reduced because of the electricity cuts imposed on final demand in Kyoto Analysis 1; the carbon value added to fossil fuel prices in Kyoto Analysis 2 has a similar downward effect on demand. And where electricity demand grows more slowly, less new generating plant is built.
In OECD Europe electricity demand would rise with a carbon value added to fossil fuel prices because of a cross-price effect: the rise in domestic gas prices would cause a shift in final demand towards electricity for heating, a shift which would more than offset any reduction in electricity demand from deliberate electricity price rises. But as any extra electricity capacity would be mostly gas-fired anyway, overall emissions would be lower in the Kyoto analyses than in the BAU projection.
Under both the market and regulatory approaches half of the reduction in emissions to meet Kyoto commitments is achieved by the expansion of non-fossil generation (nuclear or renewable) instead of coal-fired generating plants, many of which would be decommissioned early anyway. As a consequence, electricity generation from coal in the Kyoto Analyses is substantially lower than that in the BAU projection in all regions by 2010.
The Kyoto Analyses are encouraging. But they are only illustrative tools and do not necessarily represent future outcomes. In practice, policy responses are likely to combine changes in price signals, either implicitly or explicitly, with the tighter regulations. Some reduction of CO2 emissions will take place anyway without policy changes, and these estimates are already included in the BAU scenario.
There are many possible combinations of energy saving and fuel substitution that can help to meet the Kyoto commitments. The next step for governments is to identify the combination of policies that best fits their circumstances. But all involve large deviations from past trends together with considerable practical difficulties. The short time remaining to the period 2008-12 in which the Kyoto commitments have to be met makes it quite clear that change will not happen unless firm policy measures are put in place by governments straight away.
Firm action will, according to the Kyoto Analyses, deliver the right results. However, the IEA study also shows the importance of China and the other developing countries in determining growth in world CO2 emissions. These countries will play an important role in finding the long-term solution to the greenhouse gas problem.
OECD Bibliography
World Energy Outlook, IEA/OECD, 1998 (http://www.oecd.org/scripts/publications/bookshop/redirect.asp?611998221P1)
The World in 2020: Towards a New Global Age, 1997 (http://www.oecd.org/scripts/publications/bookshop/redirect.asp?031997081P1)
Energy in Developing Countries—A Sectorial Analysis, 1996 (http://www.oecd.org/scripts/publications/bookshop/redirect.asp?611994131P1)
Fatih Birol and Tomohiko Inui, ‘Long-term Trends in Asian Energy’, The OECD Observer, No. 201, August/September 1996