|
|
|
|
CIAO DATE: 10/00
The New Voting Weights in The Council of the European Union
Madeleine O. Hosli
International Studies Association
41st Annual Convention
Los Angeles, CA
March 14-18, 2000
Abstract
The recently started Intergovernmental Conference (IGC) of the European Union (EU) aims at introducing selected institutional revisions. Among these is the issue of how to allocate voting weights among the member states in the Council of the EU, especially in view of upcoming major rounds of enlargement. The paper analyzes implications of different options to re-weight votes -- the 1997 "Dutch Proposal", a shift to the square root rule, and the introduction of a double-majority clause — on the distribution of a priori voting leverage among EU governments. It also assesses the a priori probability that winning coalitions can be formed with enlarged EU membership (i.e., relative "effectiveness") for different voting schemes. In these evaluations, it is assumed that the distribution of preferences among EU governments is not known, especially as regards decisions to be taken in the future.
Acknowledgments
An earlier version of this paper was presented at the Conference Coalition Patterns in the European Union, The Netherlands Institute of International Relations, Clingendael (in cooperation with the Trans European Policy Studies Association, TEPSA), The Hague, December 10-11, 1999. In addition, it has profited from comments by members of the Working Group on Social Choice Theory, Catholic University of Brabant, Tilburg, and from helpful suggestions by Sanoussi Bilal, Axel Moberg and Alfred Pijpers.
Introduction
The European Union (EU) is a complex structure, in which different systems of decision-making, national and transnational interests, formal and informal channels of influence, intergovernmental and supranational patterns of policy-making overlap and interact. The EU’s institutional structures, moreover, have evolved over time, by both exogenous and endogenous pressures (including occasional demands for increased democratic responsiveness and enhanced effectiveness). Forthcoming EU enlargement by several new members puts a special emphasis on such challenges.
The recently started Intergovernmental Conference (IGC) will involve a complex set of negotiations on issues that need to be solved if the Union is to operative effectively and efficiently in the future. But generally, institutions are difficult to change. The scope of the new IGC, originally aimed at introducing a thorough revision of the EU’s institutional setup, is rather limited 1 . Nonetheless, several issues to be agreed upon concern matters of crucial national interest. The "Amsterdam leftovers" -- as the challenges are sometimes called that were aimed to be settled during the 1996-97 IGC, but could then not be agreed upon by the EU’s governments -- may not be all that easy to resolve.
This is certainly true for the challenge to agree on a new distribution of voting weights for EU governments in the Council of the EU. In the framework of the EU’s institutional setup, the Council, in its various compositions, is one of the most decisive intergovernmental decision-making bodies. The shift from the (often informal) de facto unanimity requirement in this institution to a variant of majority voting — usually the qualified majority voting (QMV) rule — has certainly reinforced the relevance of the distribution of votes. Even if members represented in it -- and similarly in the Committee of Permanent Representatives (COREPER) and Working Groups linked to the Council 2 -- are inclined to search for consensus in practice rather than to resort to a vote, the option to call a vote nonetheless influences the bargaining patterns and the search for possible compromise solutions in these institutions. Moreover, according to Moberg (1998), despite the essential role of the Presidency in the framework of deliberations in the Council (or its subordinate bodies) in interpreting whether there is a qualified majority in support of an issue present or not, the voting power of EU governments is rather essential. It is "constantly in the minds of all participants and influences the alliances they try to form in the negotiations. Member states are aware that they can be outvoted, and this probably tends to stimulate consensus decisions." (p. 349).
Voting weights in the Council hence are a rather crucial issue. Quite evidently, they are not the only factor influencing outcomes of EU decision-making. There can be little doubt that inter-institutional relations in the EU are crucial, the European Parliament (EP) is steadily gaining in importance, and the effects of lobbying groups or non-formal channels of power 3 , similarly, are at the core of EU development. But considering the remaining, significant impact of national influence in the EU, and the Union’s institutional structures that still allow for a rather extensive leverage of governments in its decision-making, the issue of voting weights for EU governments is certainly rather central. Efforts during the 1997 Amsterdam Summit meeting to agree on a new pattern of vote allocations — and the failure to achieve agreement on this proposal, followed by the postponement of this controversial theme to a later IGC — indicate some of the intricacies involved when dealing with the challenge to modify current voting weights.
This paper focuses on the issue of votes in the Council, acknowledging that the distribution of votes is only one of the challenges that will need to be tackled during this IGC — even in the framework of the more limited scope for the negotiation agenda. (The issue is rather closely linked, moreover, to a reduction in the total number of representatives for the European Commission). Considering the prominence of the issue of voting weights for the EU member states, it certainly is helpful to provide background analyses to different options for change. Hence, the analysis to be conducted in this paper will mainly attempt to provide information, based on social science tools, that is relevant to ongoing constitutional discussions in the EU.
In this context, it is interesting, for example, to focus on different variants that have been applied earlier and suggestions for modified vote distributions in the Council. How have votes in the Council been distributed among the EU’s member states in the past? What factors have influenced this distribution? Is the number of votes in the Council linearly -- or rather in a logarithmic pattern -- related to the population size of EU states? Or is it based on actors’ economic (or political) ‘clout’? How could the distribution of voting weights be adapted for a significantly enlarged EU? And if such propositions would find the necessary support by the EU governments in the framework of the ongoing IGC, what would be their effects on the balance of influence among individual EU governments, and when comparing the leverage of the EU’s smaller with its larger component units?
In order to provide such information, this paper will first illustrate how voting weights have been attributed to member states in the EU’s past, how these numbers are related to members’ population size, and what changes new allocations have generated on the "balance if influence" between larger and smaller states. It will also discuss the characteristics and likely effects of possible adaptations to existing patterns. In order to reflect on such issues, the article is structured as follows. Section one offers an overview of how voting weights in the Council have been attributed to the EU’s member states in the past, describing the very first allocation of votes and how this distribution was adapted in the framework of the 1973 enlargement of the European Community (an enlargement that induced a re-weighting of members’ votes). It proceeds by providing data on the way votes have been allocated to new member states in the course of the past stages of enlargement. Moreover, it presents and compares models that have been developed to "capture" the distribution of votes in the Council as a function of members’ population size and reflect the relative degree of "inequality" of vote attribution schemes. Section two follows up on this analysis and embeds the information as presented in section one into an analysis of the "balance of influence" between smaller and larger states in the Council. In the analysis, it gives an overview of governments’ a priori "voting leverage" as it can be derived on the basis of two well-known power indices (PIs), and gives information on the (theoretical) probability that EU governments could form winning coalitions in the framework of the Council’s voting procedures 4 . This information provides a foundation on which effects of a particular vote distribution and the definition of the voting threshold (the "quota") on "efficiency" and the influence of both individual states in the Council and possible coalitions among members can be assessed. Finally, the section explores options for future vote allocations, and their repercussions on both the estimated relative "effectiveness" of the Council and the relative leverage of member states as represented in this institution (or COREPER and Working Groups linked to the Council).
Section three follows up on this, but it is devoted more specifically to the study of a possible double-majority clause. It assesses the relative leverage of EU states in the Council if this clause were to be resorted to, on the basis of different assumptions with respect to the required share of the EU’s population total -- the second voting "threshold" — to be in effect.
Hence, in order to keep the study "tractable", the analysis presented in this paper will not take other effects into account, such as those resulting, for example, from agenda-setting power, inter-institutional relations or two-level game dynamics. However, the repercussions illustrated here may not only generate insights for the current discussions in terms of the a priori leverage of states in the Council, but might possibly be used as "building blocks" in studies that widen the scope of the analysis, for example, to include more EU institutions 5 .
I. Vote Allocations in the Council: the EU’s Past
Past enlargements of the EU have been accompanied by relative changes in the distribution of votes in the Council, but they were not usually paralleled by adaptations in members’ absolute number of votes. With the exception of the first, 1973 enlargement -- when the UK, Denmark and Ireland joined the European Community (EC) -- member states' voting weights were not modified. Similarly, the definition of the threshold for QMV has not experienced adaptations over time: in all stages of membership in the EU’s past, the quota to reach the qualified majority threshold was located at a level of approximately 71 percent of the total vote 6 . The maintenance of this fraction for several different constellations of membership suggests that the voting system may not have been set up "coincidentally" (i.e., mainly on the basis of bargaining on the political level), but may have implied some more exact "thinking behind the stage" 7 . Similarly, equal vote allocations were maintained through all enlargements for the largest states (including Germany and France). Figures on the distribution of votes, the requirement for reaching a qualified majority and the implied threshold for forming a "blocking minority" over time, are presented in table 1.
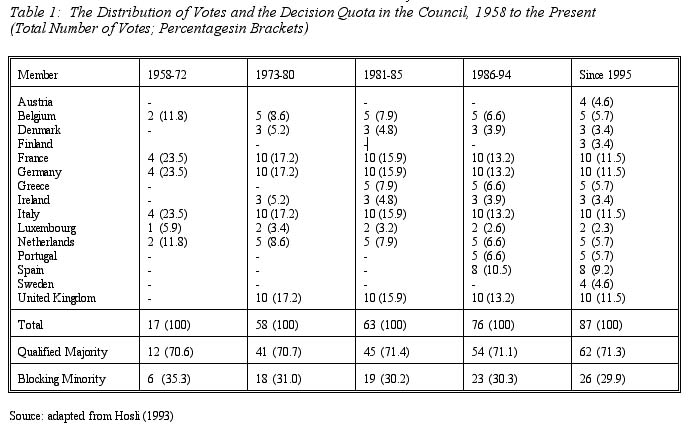
The number of votes for the largest members (then members of the European Community, EC) was increased from four to ten in the framework of the 1973 enlargement. Similarly, the number of votes allocated to the middle-sized states, Belgium and the Netherlands, was then raised from two to five. After the 1973 enlargement, voting weights, however, stayed constant for all EC states and new members obtained shares roughly corresponding to the ones held by EC members of comparable size 8 .
For example, in the framework of the 1981 enlargement, Greece obtained five votes — the same number of votes as Belgium and the Netherlands had obtained earlier. Similarly, in 1986, Portugal received five votes, and Spain eight (as its population size was between that of the largest and the middle-sized members). Up until the 1995 enlargement -- with the exception of the first constellation of membership -- no country obtained four votes. This allocation occurred, however, for Austria and Sweden when joining the EU in 1995.
In order to illustrate the relationship between population size and number of votes in the Council, table 2 presents the population figures for member states at different stages in the EU’s history 9 . The figures refer to the inception of the Community in 1958, its first enlargement in 1973, the "Iberian" enlargement by Portugal and Spain in 1986, and the most recent 1995 enlargement.
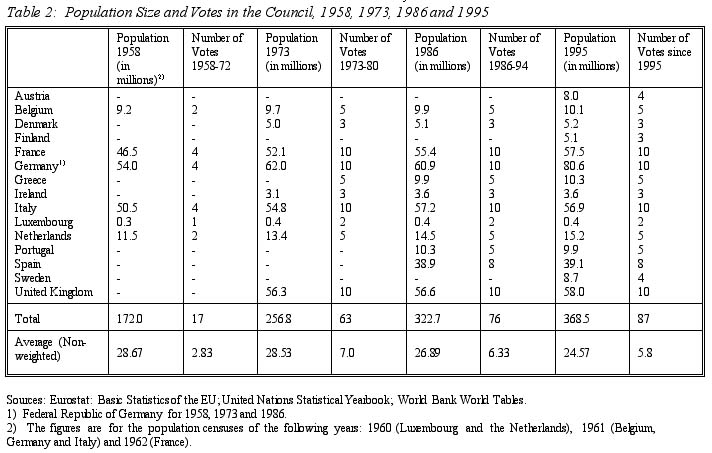
Hence, the relationship between population size and the number of votes allocated to member states has varied somewhat within groups of similar size over time. For example, in the framework of the first constellation of membership, population size of the large members ranged from 46.5 million (France) to 54 million (Germany). As of 1986, the respective range was from 55.4 million (France) to 60.9 million (Germany). Nonetheless, votes were allocated to both states on an equal basis, as both obtained four votes starting in 1958, and ten in 1973.
Similarly, there was some variation in the group of states that currently hold five votes in the Council: the population size of these states was between 9.2 million (Belgium) and 11.5 million (Netherlands) in the late 1950s, and between 9.9 million (Belgium) and 14.5 million (Netherlands) in 1986. The small difference in the number of votes allocated to Denmark and Ireland as compared to Luxembourg is also interesting: Luxembourg with a population of .4 million obtained two votes in the Council in 1973, and Ireland and Denmark with populations of 3.0 million and 5.1 million in 1973 respectively, three votes. How can such distributions and differences within groups be analyzed more thoroughly and patterns be explained?
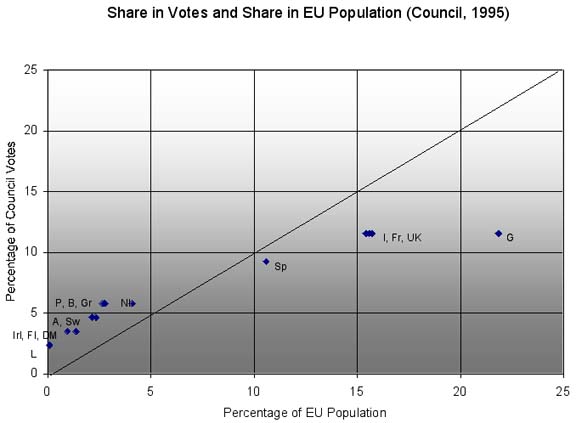
Figure 1 provides a graphical display of the distribution of votes in the Council as compared to total EU population for 1995. The figure illustrates the relatively favorable treatment of the smaller states as compared to a purely "proportional" distribution. Located "above" the proportional line are members that are over-represented (as compared to population size) and "below" the line those that are underrepresented. The distance from the proportional line provides an indication of the relative extent of deviation for the individual cases. Clearly, the distribution of votes in the Council is essentially "progressive", implying that the relative share of votes of smaller members is higher than that of larger states (when compared to population size). A cluster of countries including Portugal, Belgium and Greece indeed appears to be rather favorably represented, whereas others, especially the larger members, are "underrepresented" when compared to a proportional scheme.
Quite generally, the distribution of votes in a comparison between smaller and larger members can be illustrated nicely by the means of "Lorenz curves" 10 , here showing the distribution of votes as compared to population size for different constellations of EU membership. Subsequently, an overview will be provided with respect to population as compared to votes in the Council for 1958 and 1995. In these graphs, we will be interested in relative changes in "proportionality", but use them also for a different purpose. The graphs not only illustrate the relative degree of "inequality" -- as compared to a proportional distribution -- but can also show which (minimal) fraction of total population was required to either obtain the QMV threshold in the Council or to constitute a "blocking minority": the intersection of the curve with a horizontal line at 71 percent of the total vote (on axis y) gives — on the horizontal axis, read off from the right — the minimal EU population as represented in the Council that can prevent a QMV decision from passing (x1). The intersection of the Lorenz curve with a (horizontal) line at 29 percent of the total vote indicates the minimal share of EU population that is necessary to support a proposal, as represented through votes in the Council (at point x2, read off again from the right-hand side).
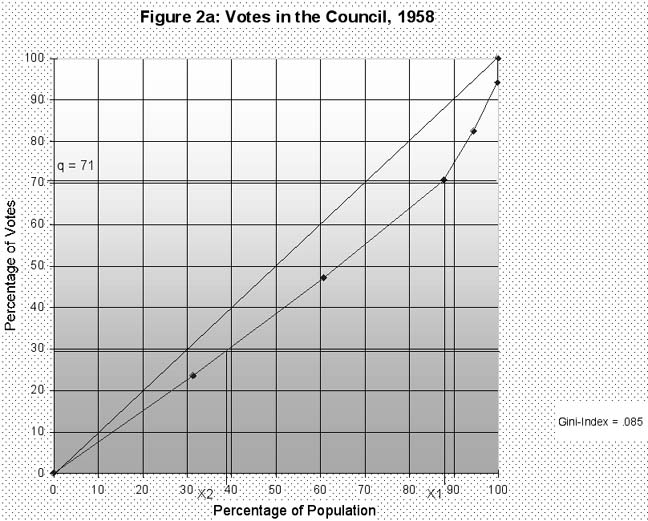
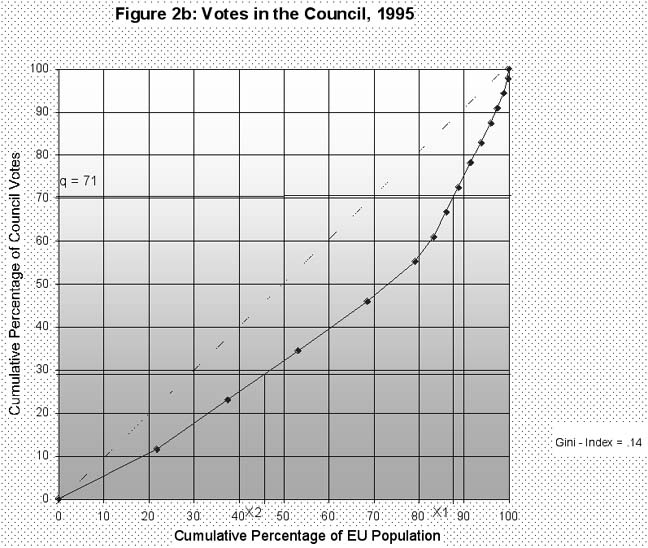
As regards reaching the minimum blocking minority threshold in the framework of QMV, it has often been stressed that this share may have decreased over time. Indeed, this appears to be a reasonable assumption when the vote distribution as illustrated in figure 1 is taken into account. Figures 2a and 2b confirm that the distribution of votes in the Council in both 1958 and 1995 favored smaller members, but the relative advantage for smaller states appears to be more pronounced in 1995 than it was in the beginning of the Community (as the Lorenz curve has shifted "outwards" and away from a proportional distribution). The Gini-Index for the 1958 constellation of membership, indeed, is .085 (as compared to .14 in 1995) 11 . These trends are largely due to the increased share of small and medium-sized members over time, a point that has rather often been stressed especially by the EU’s larger states. A relatively common assumption hence was that QMV decisions, in an extreme case, might even be taken by a fraction of less than 50 percent of the EU’s population (as represented in the Council) in the framework of the current system. However, Moberg (1998), on the basis of population figures, has illustrated that this is not the case. Figure 2b supports his finding: the minimal required fraction of EU population to obtain a qualified majority was about 62 percent in the first constellation of membership, and has decreased to about 54 percent in 1995.
How can such vote distributions be expressed by a mathematical formula? Generally, there are different plausible options to allocate voting weights to members in a voting body in relation to selected variables (such as population size). For example, the relationship could simply be proportional: a one unit increase in population (usually measured in millions) results in a one unit increase in the number of votes. In figures 2a and 2b above, this would imply that the distribution of votes would follow the proportional line starting in the origin of the two-dimensional setup. This method of allocation, however, implies a risk that smaller members feel dominated by the larger ones. A more appealing solution in practice hence is to resort to a progressive distribution, in which smaller members obtain a more than proportional voting weight as compared to their population size (as this is practiced, for example, in the framework of different second chambers of parliaments in federal systems, including the U.S., Germany and Switzerland). This system of representation has the advantage of providing a protection for the smaller constituent units in a federally structured political system. Overrepresentation should be within reasonable limits, however, to prevent larger states from feeling dominated by the smaller ones, and to increase their perception of the "legitimacy" of the system 12 . Instead of allocating votes on the basis of population size, other "weighting" factors might be used, such as a country’s total geographical area or its economic power (as measured, for example, by members’ GDP), or contributions to the organization’s overall budget 13 .
What method was used for the distribution of votes in the Council? What is the relationship that currently holds? A few studies have so far been presented that attempt to model the number of votes in the Council as a function of another variable, usually population size. None of these models were elaborated as an exercise in itself, but they were rather generated in the framework of an analysis of other issues of institutional design. Nevertheless, their most essential elements will be discussed here (for more technical details on these models, see Appendix A to this paper). For example, Mika Widgrén (1994: 1155) has applied a regression analysis to assess the relationship between population size and the number of votes in the Council. The formula he obtains is a logarithmic relationship between population and votes. Essentially, the logarithm of population size is multiplied by a small constant and raised to the power of 2.46 in order to derive the logarithm of the number of votes. As the author indicates, if the formula were to be applied to the current Council, Germany after reunification might obtain 12 votes instead of 10 (p. 1162).
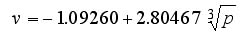
Berg and Lane (1996: 27-28) base their analysis on results developed earlier by Taagepera and Shugart (1989). Taagepera and Shugart’s model establishes the "cube root rule" of assembly size, according to which the size of an assembly may be estimated by taking the cube root of a state’s population. The model by Berg and Lane takes the cube root (x0.33) of an EU member’s population size, multiplies it by a factor of 2.8 and subtracts 1.09 from this total to derive the number of votes in the Council. This formula is also obtained on the basis of regression analysis.
In a study applying curve-fitting to the distribution of votes in the Council, Hosli and Wolffenbuttel (1999) derive a relatively easy formula to assess the relationship between population size and votes:
where p stands for a state’s population size (in millions) and v for its number of votes in the Council.
What are the results when these three formulas are applied to the distribution of votes in the Council? Table 3 provides the respective calculations for the 1986 and 1995 constellation of EU membership.
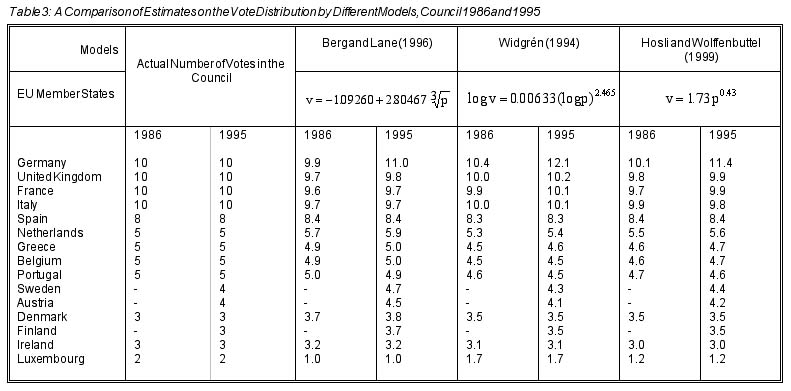
As table 3 illustrates, all three models indeed capture the distribution of votes for 1986 rather closely (Widgrén’s model, after rounding, even provides the exact number of votes for all states). In both the Taagepera and Shugart and the Hosli and Wolffenbuttel models, the Netherlands might have obtained 6 rather than 5 votes already in 1986. All models, moreover, illustrate the following trend: Germany, after reunification, has left its "group boundaries" (this is also true in 1995, albeit to a more moderate extent, for the Netherlands, Denmark and Finland). Two of the three models -- not the one presented by Mika Widgrén -- use a threshold at the level of 2 votes for Luxembourg. Although all models are rather apt to "capture" the current vote distribution in the Council, and Mika Widgréns model turns out to make the most exact forecasts for the 1995 enlargement, the following analysis will apply the Hosli and Wolffenbuttel formula for its easy applicability and its ability to capture vote distributions since 1973. Application to earlier phases in the EU’s history on the basis of equation (1) are given in tables 4a and 4b.
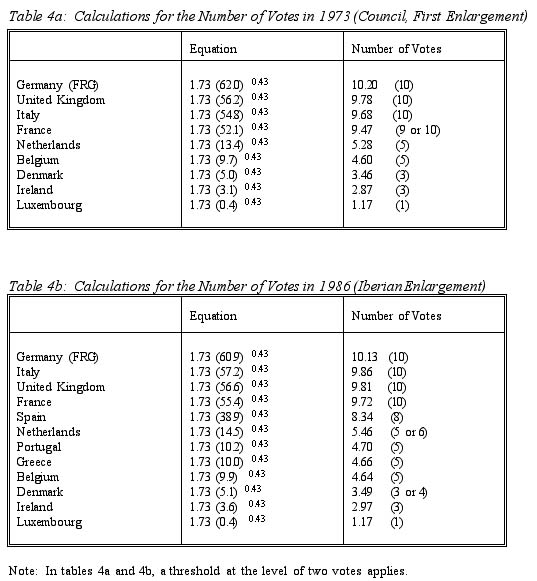
A small divergence from the forecast occurs with respect to the situation of France for the 1973 distribution of votes, as France might have obtained 9 rather than 10 votes then. The deviation, however, is quite small (and equal allocation of votes to all large members most likely was inevitable on political grounds).
Different options have been and currently are considered for new vote allocations. For example, in formula (1) above, it would be possible to either enhance the constant (from 1.73) or the exponent (from .43) to enhance the relative leverage of the larger members as compared to the smaller ones. A widely discussed proposal to re-weight votes was tabled (and published) by the Dutch Presidency in 1997 14 . Essentially, the main option proposed then was a scheme in which the EU’s four largest members -- Germany, France, Italy and the UK -- would all obtain 25 votes, Spain 20, the Netherlands 12, and Belgium, Greece and Portugal 10 votes each. Austria and Sweden, according to this scheme, would obtain 8 votes, Denmark, Finland and Ireland 6, and Luxembourg 3 15 .
If votes are related to population size exclusively, another possible option is the "square root rule" 16 . In this scenario, the square root of a member state’s population size (as measured in millions) matters. Hence, according to this scheme, a population of one million inhabitants entitles a state to one vote, of four million to two, and of 16 million to four votes. A variety of other options are possible. Most proposals that have been presented in practice, however, appear to be rather close to the one tabled by the Dutch Presidency (Moberg 1998: 365).
What vote distributions would respective adaptations generate? An option for altering voting weights could be, for example, to raise the constant in equation (1) to 4. This would result in a distribution relatively close to the "Dutch proposal", but with the significant difference that Germany would get 27 votes as compared to the other large members (23 votes), an option that may hence be politically somewhat unattractive. If the constant is reduced to the value of one and the exponent in equation (1) is increased to .5, the "square root rule" results. Table 5 provides an overview of possible allocations for the example of an EU enlarged to 21 members.
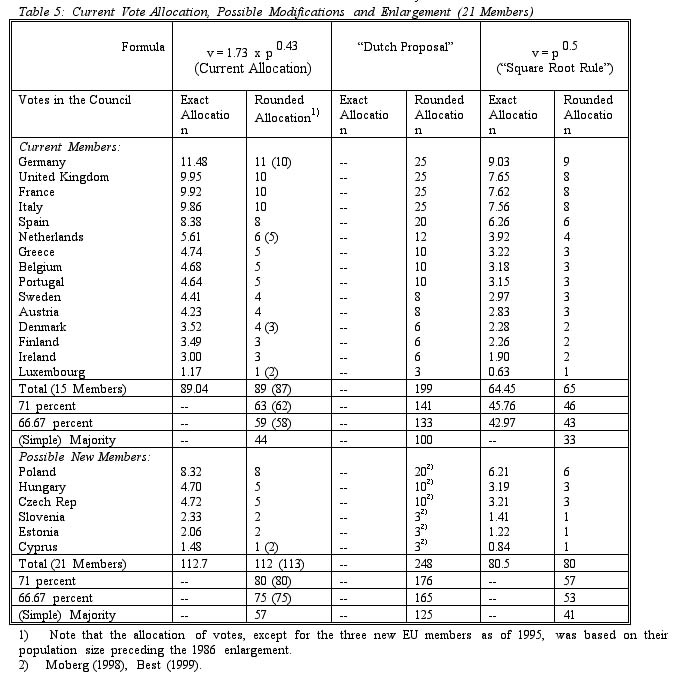
Compared to the current distribution of votes and the Dutch Proposal, the range of allocation in the framework of the square root rule would generally be compressed: in this scenario, Germany would obtain nine votes (or eight if equality among the largest members is considered to be politically preferable), the Netherlands four and Luxembourg one. This scheme would have the drawback that differentiation between countries with similar population sizes is more difficult, but it would have the advantage of being a relatively straightforward and transparent formula that could determine vote distributions for several EU enlargements in the future.
How would the Dutch proposal and the square root rule affect the proportion of votes in the Council as compared to EU population size? Figures 3a and 3b provide a graphical display of the two options, here in the framework of the 15-member EU.
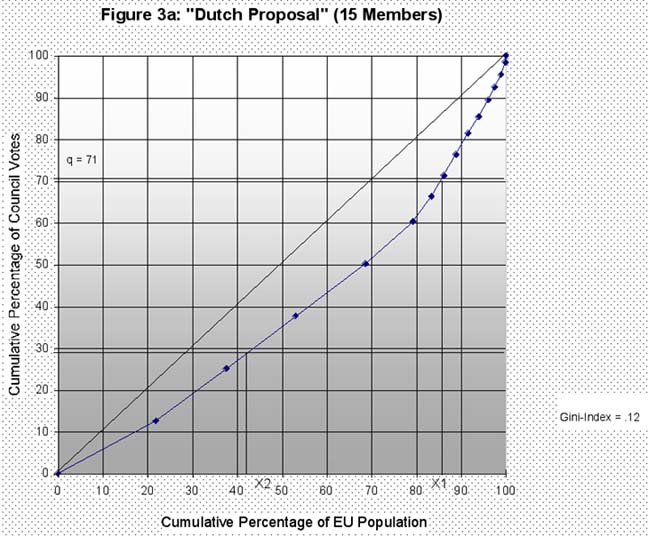
Hence, re-weighting according to the Dutch proposal would indeed result in an adapted distribution in which the "minimal" qualified majority, in the current constellation of membership, would be about 57 percent of the EU’s total population (whereas a "minimal blocking minority" could be formed by about 14 percent of total EU population as represented in the Council). By comparison, the square root rule would push the minimal percentage for a qualified majority vote up even further, to about 58 percent of total EU population (at point x2). It is interesting to note, however, that the Gini-Index for either option would essentially be equal (.12). Hence, these options would not generate the same extent of proportionality as in 1958, but they would somewhat reverse the trend of the last series of enlargements as compared to the 1995 constellation of EU membership.
II. Voting Weights, Voting Power, and Efficiency
For an a priori, "constitutional" analysis of QMV in the Council, the following sections will use techniques based on cooperative game theory and the theory of simple games more generally. The approach appears to look to many like an "old-fashioned" device, but it may certainly be worth being considered again today in the face of challenges such as reform of the Council’s voting rules — especially in an era where computers can easily handle the necessary simulations.
With respect to analyzing the EU, two options appear to be particularly interesting in this context. One option is to derive estimates on the probability that members will be able to form winning coalitions in the Council’s voting procedures 17 . This provides an interesting guide to assess the overall "efficiency" of a voting system. For example, in the framework of the formal unanimity requirement, the relative extent of efficiency is usually comparatively low, as only one coalition in all possible coalitions among members can be winning (the "grand coalition" that consists of all members). Simple majority rules increase "efficiency", but may have the drawback of reducing members’ sense of the "legitimacy" of the system. Enlargement will certainly have effects on both (as it will on the ever more prominent QMV rule, to be discussed below).
In addition, it is helpful to see how weighted voting schemes translate into the relative a priori voting power of members. In this context, the two most well-known "power indices" that have been developed are likely to be the (normalized) Banzhaf index of power and the Shapley-Shubik index. Several other measures exist (e.g., see Holler 1981, 1998). But the two most well-known indices will be used subsequently, especially for the analysis of possible new vote distributions in the Council, in order to gain some insights into the effects of adapted vote allocations on voting power 18 . These measures have the additional advantage that the quantitative effects of different propositions — whether re-weighting schemes or the double-majority rule -- can be rather easily compared to each other 19 .
Developments with respect to power indices in the EU’s past partially illustrate the increased need for EU governments to build coalitions with other states in the Council, largely due to relative decreases in individual voting power as a result of successive rounds of enlargement. Moreover, in the framework of voting power analysis, it may be possible to try to derive "fair" vote allocations for the Council 20 .
In terms of the assessment of the relative extent of "efficiency" of a voting scheme, it is helpful to analyze the effects of different voting quotas (thresholds) on the share of possible winning coalitions in the total of possible coalitions among members (for the mathematical background to this analysis, see Annex C of this paper). As it is unclear which kinds of "winning coalitions" will form among EU members in practice, especially for future decisions, it is reasonable to depart from the assumption that essentially, all members can participate in winning coalitions (the analysis can be constrained once it is certain that some coalitions form rather constantly and are expected to be stable in the future). For the current constellation of EU membership, table 6 provides an overview of such effects.
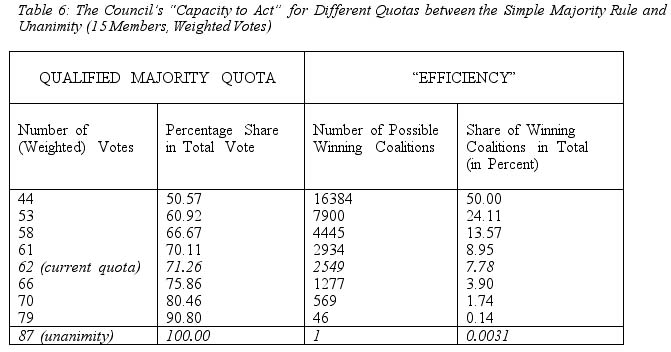
As table 6 illustrates, the decision quota certainly does affect the probability that winning coalitions among members are formed. If the voting quota in the current constellation of EU membership were a (simple) majority, essentially one in two coalitions (or 50 percent of the total) would be able to attain the required threshold. If the threshold is raised to the current quota, the share of possible winning coalitions in the total is 7.8 percent. If it is raised to 80 percent, the respective fraction decreases to approx. 1.7 percent 21 . It should be mentioned that this analysis does not only take minimal winning coalitions (MWCs) into account, but any coalitions that meats the decision threshold (hence, it includes all "surplus majority coalitions").
In a historical overview, table 7 illustrates how enlargement has effected the probabilities that winning coalitions were formed under both the QMV and the unanimity rule. Whereas it is generally assumed that unanimous voting becomes more tedious when more members join a committee — a factor strengthening incentives for applying QMV -- this effect has not so much gained attention in current debates on the threshold to be used for QMV 22 .
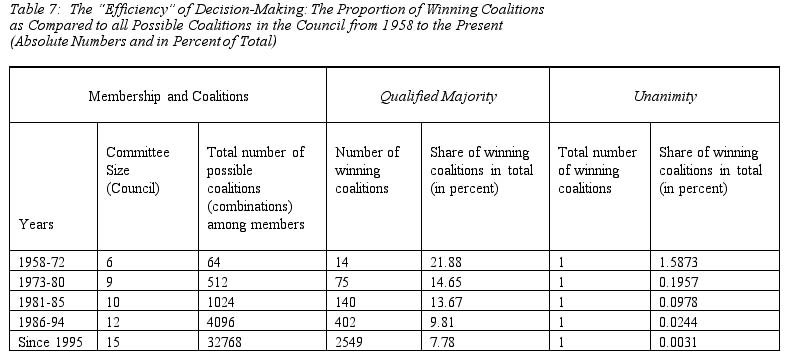
In fact, the share of possible winning coalitions in the total has also decreased under the qualified majority rule, from more than one-fifth in the beginning of the Community’s existence to about 7.8 per cent in the framework of the current constellation of EU membership.
What would the effects be if the EU were to be enlarged, for example, to a number of 21 in the near future? Table 8 demonstrates likely effects on the basis of possible vote allocations as discussed above (table 5) for both the 15-member and a 21-member EU, that is, on the basis of an extrapolation of the current vote distribution, the "Dutch Proposal" and the "square root rule". The table also provides figures for a comparison between the current decision threshold (71.3 percent) and a possible two-thirds majority rule (66.7 percent) under each scheme.
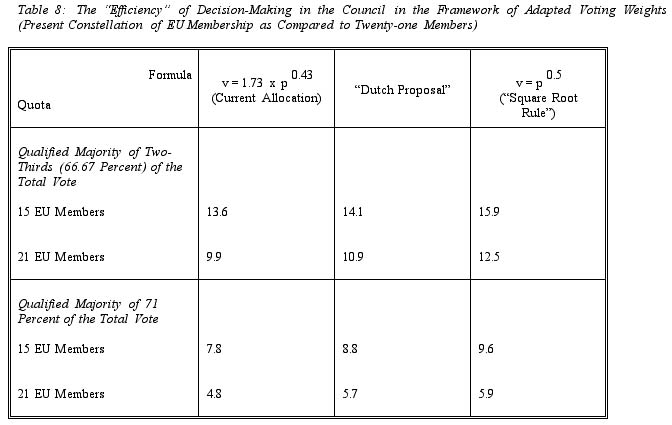
The results of table 8 indicate that effects on the relative "efficiency" of decision-making will not vary much among different weighting formulas, although the "square root rule" increases efficiency to a moderate extent as compared to the other schemes. Hence, in probabilistic terms, it should not matter much for the relative capacity of the Council to act which scenario of voting weight allocation is chosen (of course, the distribution of preferences in each specific case will matter, but that is another issue). By contrast, the voting quota is rather relevant, as a comparison of the effects of the 71 percent and the two-thirds majority rule illustrates. For example, in the framework of the Dutch Proposal, the share of potential winning coalitions in the total under the two-thirds rule is about 14 percent (15 members) or 11 percent (21 members), as compared to about 9 percent (15 members) or 6 percent (21 members) with the current threshold. Similarly, with the current vote allocation and quota, the share of winning coalitions in the total is about 8 percent (15 members) or 5 percent when the system is extended to 21 members, but would increase to 13.6 percent (15 members) or about 10 percent (21 members) under a two-thirds majority rule.
Certainly, effects of different vote allocations are not only important in terms of the efficiency of overall decision-making, but also with respect to members’ propensity to affect decisions, which will here be measured, in an a priori perspective, as their ability to be crucial to the fate of a coalition among EU governments. Generally, this study will focus on a member’s capacity to affect the formation of a "winning coalition", but considering the centrality of "blocking coalitions" in EU decision-making, figures will partially be provided for members’ relative leverage to constitute blocking coalitions 23 . The subsequent analysis uses two well-known "power indices" to assess such effects (on the background to these indices and examples on how they are calculated, see Appendix C to this paper) 24 .
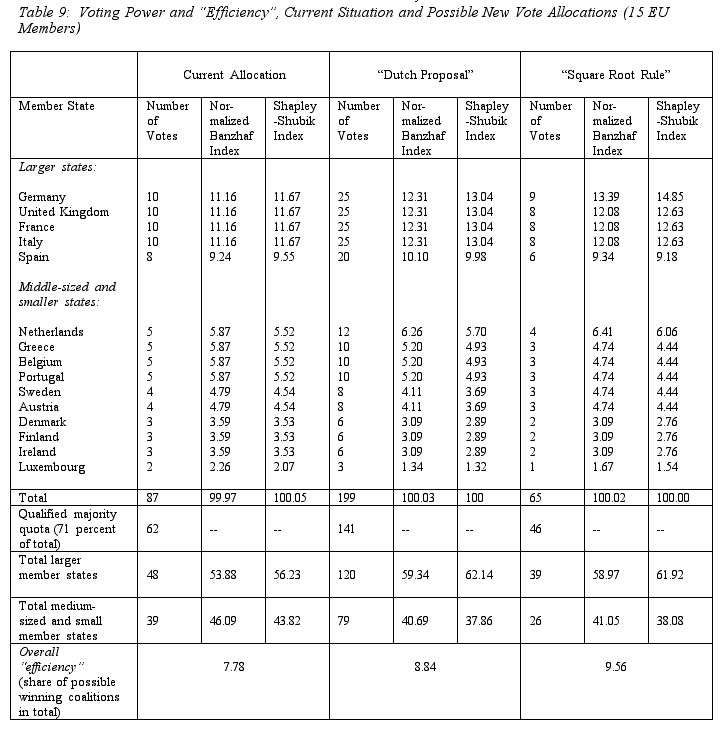
As the results illustrate, the Shapley-Shubik index, for the analysis of the Council, attributes somewhat more influence to larger members than the (normalized) Banzhaf index does. But in spite of this, the two indices generate rather close results. The calculations show that the square root rule is more favorable for the situation of Germany than the "Dutch Proposal" would be, but both schemes enhance its relative a priori voting power as compared to the current situation. By comparison, the relative leverage of the other large members is enhanced somewhat more by the Dutch proposal than by the square root rule. Spain would benefit to a rather moderate extent from a revision according to the lines of to the Dutch proposal, whereas its situation would not be significantly affected (or be even moderately less favorable as compared to the current system) under the schemes of the square root rule.
The situation of the Netherlands, in relative terms, would -- by a moderate extent -- be improved under both revised schemes. The position of Sweden would essentially be unaffected (as compared to the current situation) if the square root rule were to be introduced, and it would moderately deteriorate if the Dutch proposal were to be implemented. All other middle-sized and smaller members would rather lose in terms of relative voting power under either modified scheme.
In terms of the "balance of influence" between large and small members, table 9 illustrates that the share of larger members in overall voting power in the Council would increase to a similar extent with both the Dutch proposal and the square root rule. Under both modified schemes, the five largest members together would hold about 60 percent of total voting power (as compared to a share of about 55 percent at present).
Table 10 extends the analysis to an EU consisting of 21 members for the three scenarios discussed above 25 . In this analysis, it will suffice to provide the values for one index 26 , in order to compare the effects of different re-weighting schemes on relative a priori voting leverage 27 .
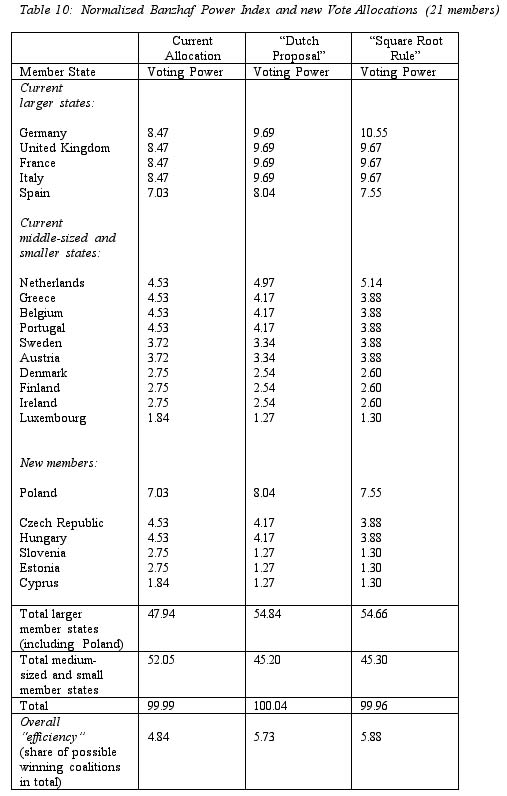
Calculations for an extended Union (here for the example of 21 members) are rather similar to those presented above for the EU’s current membership. Essentially, the square root rule would benefit Germany most as compared to the current vote allocation, but also improve the situation of the other large states (including, to a more moderate extent, Spain). By comparison, the Dutch proposal would increase the leverage of all larger members, but not to the same extent for Germany as the square root rule would. In the example of a 21-member EU, the situation of the Netherlands would be moderately improved as compared to the current vote allocation if either the Dutch proposal or the square root rule were to be introduced. Austria and Sweden would also slightly benefit from the introduction of the square root rule. By comparison, the relative a priori voting leverage of other medium-sized and smaller members would decrease with either option to modify voting weights.
Hence, in the framework of a 21-member EU, the relative share of voting power of the five largest members would increase with either one of the two main re-weighting schemes, to approximately 55 percent of the total as compared to about 48 percent when the current system of vote allocation were to be maintained.
III. Effects of a Double-Majority Rule
Alternatively, another option could be introduced for voting in the Council that has been discussed rather intensively in the recent past: the double-majority rule. In the framework of the double-majority provision, decisions in the Council would not only require a given threshold in terms of weighted votes, but also the support of a given fraction of the EU’s total population (as represented by governments in the Council). This option might be easier to be accepted politically in smaller EU states (Moberg 1998), and indeed appears to be an option supported by several small members (Zbinden 1999). What would the effects of this system be on the overall "effectiveness" of voting in the Council and on the relative a priori leverage of member states in it?
So far, the analysis presented in this paper has been concerned with decision-making in the Council when a majority is required on one dimension (a qualified majority of the total vote). How would the distribution of a priori voting power and the relative ease of making decisions change when a double-majority rule were to be introduced? In order to address this question, different options will subsequently be analyzed.
The scenario focused on here will analyze a double-majority system in which members’ votes in the Council are weighted as at present and the second requirement is a given fraction of the EU’s population total 28 . The option of a double-majority rule was earlier advocated by Germany’s Christian Democrats and has more recently gained attention in the political discussions on reforming the Council’s voting procedures 29 . It is also mentioned as an option in the June 1999 Presidency Conclusions of the Cologne European Council, and in the July 1999 "Presidency Non-Paper" 30 .
If this system were to be adhered to, what effects would it generate on the "balance of influence" between large and small members in the EU (especially as compared to the current scheme and the re-weighting formulas discussed above)? And what would be the effects of such a modification on the relative extent of "efficiency" of decision-making in the Council (as assessed in "technical" terms)?
Intuitively, the Council’s ability to reach decisions may be expected to decrease if a second threshold is introduced. Methodologically, the Council’s relative "capacity to act" can be calculated by assessing the fraction of winning coalitions that simultaneously meet both decision requirements. In an analogous way, voting power analysis for the double-majority scheme focuses on "critical defections" in the framework of "double winning coalitions". An additional measure that will be provided here with respect to the double-majority rule is the share of potential "blocking coalitions" in the total, that is, the fraction of coalitions among members that can block a proposal with respect to either dimension one (the regular QMV threshold) or dimension two (the required share in total EU population). (On the methodology applied here to assess relative "efficiency" and members’ relative voting power in the framework of the double-majority rule, see Appendix D to this paper). In order to make the estimates fully compatible with current discussions, the subsequent calculations will be based on population figures as provided in Council of the European Union (1999) 31 .
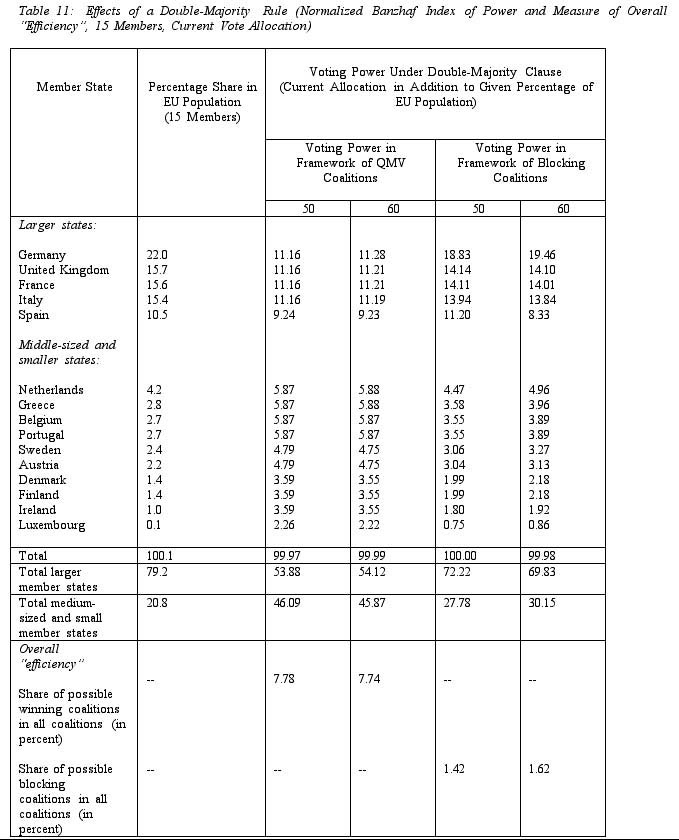
The results provided in table 11 illustrate that, as compared to the current system, the introduction of a double-majority rule would hardly affect members’ capacity to be crucial for the formation of qualified majority coalitions, as figures on relative a priori power are close to those under the current system. By comparison, if two decision quotas are to be met simultaneously, members’ capacity to affect the formation of a "blocking minority" under the QMV rule is certainly affected. The last two columns of table 11 provide the respective indices when the capacity of EU states to affect the fate of a "blocking coalition" is assessed (the second quota being either 50 or 60 percent of total EU population). Under the 60 percent population quota, the relative influence of larger members is enhanced more than with the 50 percent threshold (as they may generally constitute a larger share of a potential blocking minority), but either option would clearly benefit larger members. Hence, whereas a double-majority clause would not generally affect the capacity of larger members to influence the formation of winning coalitions, it does crucially enhance their possibilities to form blocking minorities in the framework of the Council’s decision procedures. By comparison, the relative leverage of the smaller and medium-sized members would deteriorate under the double-majority clause, although to a lesser extent for the Netherlands than for other members in this group.
In terms of the "balance" between larger and smaller members, table 11 illustrates that whereas the larger EU members currently hold about 80 percent in total EU population, their shares in relative voting power as regards the formation of qualified majority coalitions would be about 54 percent under the double-majority clause (this is a fraction similar to the current system). In the context of blocking minorities, however, their total leverage would be about 70 percent of total voting power.
As regards the overall "efficiency" of the scheme, the findings illustrate that the share of possible winning coalitions in the total would not be significantly affected by the introduction of a double-majority clause (as figures in the last row of table 11 indicate). Although the fraction of potential winning coalitions in the total is somewhat lower with the double-majority clause than under the major re-weighting schemes discussed above, even an increase to a second quota of 60 percent in the framework of a double-majority rule would not generate significant effects on the overall "efficiency" of the system as measured here, as the theoretical share of potential winning coalitions in the total would then still be 7.74 percent (with a quota of 70 percent, this share would only slightly decrease to 7.32 percent). This relative stability of the fraction of potential winning coalitions that meet both "thresholds" is most likely due to the fact that a double-majority clause along the lines discussed in this paper would imply a "double weighting" formula (as members’ votes, in practice, would be weighted in terms of both the regular QMV provision and members’ population size). By comparison, the share of "blocking coalitions" in the total is affected with the introduction of a double-majority clause: whereas with the current system of vote allocation and 15 EU members, the share of possible blocking coalitions in the total is .92 percent, this share would increase with the introduction of a 50 percent population quota to 1.42 percent of the total (and to 1.62 percent if the second threshold were to be set at 60 percent of EU population).
How would the "effectiveness" of the system be affected under this scheme, however, when the EU is enlarged? From the insights generated above for re-weighting schemes and the double-majority rule, the following preliminary conclusion can be derived: with increasing EU membership, "efficiency" will be reduced, especially under the double-majority scheme (when the capacity to form "blocking coalitions" is assessed). Expressed as a fraction of potential winning coalitions in the total of possible coalitions among members, on the basis of tables 9, 10 and 11, it can be seen that with an increase by about six EU members, "efficiency" tends to decrease by 3 to 4 percentage points with different re-weighting schemes. Comparing tables 9 and 10, it is reasonable to assume that the capacity to form winning coalitions in the framework of a double-majority clause for 21 members should not be significantly different from that existing under different re-weighting schemes (as reported in table 10 for the example of a 21-member EU). But if the potential to block decisions is considered, "efficiency" is reduced even further with a double-majority clause, especially when the EU is to be enlarged by several new members.
IV. Conclusions
It is far from easy to agree on new voting weights in the Council. Institutions — and linked to this, the distribution of influence within them — are difficult to change. New voting weights in the Council will certainly have repercussions on the balance of "voting strength" among EU states — both current and future ones -- and also affect patterns of coalition-formation in the Council. This paper provides a background analysis to different options that are currently being discussed with respect to re-weighting votes in the Council, or to resort to a double-majority clause.
The paper uses "Lorenz curves" to illustrate the distribution of votes among EU governments in the Council (as compared to their share in total EU population) for the EU’s past and present, and evaluates the effects of modified allocations. These approaches have the advantage that the relative extent of "inequality" as compared to a purely proportional vote allocation can be demonstrated in a rather straightforward way. Moreover, such illustrations can graphically demonstrate how the distribution of votes among EU member states determines the size of a "minimal blocking minority" (the minimal share of total EU population, represented in the Council, that may prevent a proposal from being adopted within this institution), or the "minimal qualified majority" of EU population that may get a proposal backed in the framework of the Council’s QMV rule. On the basis of this analysis, it is shown in this paper that the current situation as compared to the first phases of the Community’s existence is more favorable to smaller members, but that the effect is not quite as extensive as it sometimes appears to be assumed. More specifically, the analysis demonstrates that in the current 15-member EU, it is not possible that a "majority" of EU population as represented in the Council could be outvoted by a "minority" of total EU population in the framework of the QMV rule.
In addition to this, the paper illustrates how voting power analysis may be used in the framework of constitutional analysis -- here especially applied to the future of the EU -- and to assess the effects of possible modified vote distributions in the Council. Currently, actors do not know what policy positions they will be advocating in the Council in the future. They essentially act behind a "veil of ignorance". Thus, a new voting scheme will be introduced without members knowing whether they will be rather in opposition to certain issues in the future or supportive of them, whether their preferences will be "extreme" or in the "center" of respective scales and hence, who their "coalition partners" will be. An analysis of relative voting power for earlier constellations of EU membership — as it has been presented by different authors in the past — is here extended here to study effects of alternative vote distributions (and of enlargement). Moreover, the study illustrates how new vote allocations might effect the Council’s overall "capacity to act", i.e. its "efficiency" of decision-making (again as assessed from an a priori perspective).
With respect to two possible re-weighting schemes, the "Dutch proposal" and the "square root rule", it is shown that either of these modifications would increase the relative leverage of larger EU members, although effects are more favorable to Germany with thee latter scheme (the reverse being true for the other large members). Both options to modify vote allocations would enhance the collective voting power of the larger EU states as compared to the medium-sized and smaller ones, attributing them, in the framework of the current 15-member EU, about 60 percent of total voting power (as compared to about 54 percent as at present).
Finally, the paper shows effects when a double-majority clause were to be introduced: how would such an adaptation affect the relative influence of EU governments in the Council and the overall ability of this institution to reach decisions (again as assessed in a priori terms)? How do these effects compare to those generated by a re-weighting of votes?
A double-majority clause, as this paper illustrates, would influence the distribution of a priori voting power among members in the Council, but essentially only by affecting members’ capacity to be crucial in "blocking coalitions" (rather than "winning coalitions"). The analysis demonstrates that as compared to different re-weighting schemes, the smaller and medium-sized EU members would lose relative a priori influence if a double-majority clause were to be introduced, but essentially only in terms of their capacity to build blocking minorities. The paper also finds that a double-majority clause would affect the probability that blocking coalitions among members are formed in the Council (here measured in terms of the share of potential blocking coalitions in the total of possible coalitions among EU governments). By comparison, the potential share of winning coalitions among members remains relatively constant, also with variations in the second "threshold". It is hence to be expected that enlargement by several new EU members under the double-majority clause would decrease the Council’s "capacity to act" more than if either of the re-weighting schemes currently discussed were to be in force.
References
Banzhaf, John F. III (1965): "Weighted Voting Doesn't Work: A Mathematical Analysis", Rutgers Law Review, 19, 317-43.
Berg, Sven and Lane, Jan-Erik (1996): "Game Theory, Power, and the European Community", in Matti Wiberg, ed., Multidisciplinary Views on Strategic Interactions. Studies on Political Science no. 14, Department of Political Science, University of Turku (Finland), pp. 17-34.
Best, Edward (1999): Why Are We Weighting? Institutional Reform and the Representation of States in the European Union, Discussion Paper for the Colloquium "Rethinking Europe for the New Millenium", Maastricht, 5-6 November.
Coleman, James S. (1971), "Control of Collectivities and the Power of a Collectivity to Act", in Lieberman, ed., Social Choice, Gorden and Breach, 277-287.
Council of the European Union (1999): Presidency Non-Paper, Brussels 9 July, SN 506/99.
Dixon, William J. (1983): "The Evaluation of Weighted Voting Schemes for the United Nations General Assembly", International Studies Quarterly, 27: 295-314.
European Parliament (1997): Summary of the Positions of the Member States and the European Parliament on the 1996 Intergovernmental Conference. Secretariat Working Party, Task-Force on the "Intergovernmental Conference, JF/bo/290/97, Luxembourg, May.
Hayes-Renshaw, Fiona and Helen Wallace (1997): The Council of Ministers. Houndmills, Basingstoke : Macmillan Press/ New York : St. Martin's Press.
Holler, Manfred J., ed. (1981), Power, Voting and Voting Power. Würzburg: Physica.
Holler, Manfred J. (1998), "Two Stories, One Power Index", Journal of Theoretical Politics, 10, 179-190.
Holler, Manfred and Mika Widgrén (1999), "Why Power Indices for Assessing European Union Decision-Making?", Journal of Theoretical Politics, 11, 321-30.
Hosli, Madeleine O. (1993): "Admission of European Free Trade Association States to the European Community: Effects on Voting Power in the European Community Council of Ministers", International Organization, 47, 629-43.
Hosli, Madeleine O. (1995): "The Balance Between Small and Large: Effects of a Double-Majority System on Voting Power in the European Union", International Studies Quarterly, 39, 351-70.
Hosli, Madeleine O. (1996): "Coalitions and Power: Effects of Qualified Majority Voting in the Council of the European Union", Journal of Common Market Studies, 34,2, 255-73.
Hosli, Madeleine O. (1998), An Institution’s Capacity to Act: What are the Effects of Majority Voting in the Council of the EU and in the European Parliament?, Current European Issues, Maastricht, NL: European Institute of Public Administration.
Hosli, Madeleine O. and Wolffenbuttel, Reinoud F. (1999): The Distribution of Votes in the Council of the European Union, Paper presented at the 40th Annual Convention of the International Studies Association, Washington DC, February 16-20.
Johnston, Ronald J. (1995a): "The Conflict over Qualified Majority Voting in the European Council of Ministers: An Analysis of the UK Negotiating Stance using Power Indices", British Journal of Political Science 25: 245-54.
Johnston, Ronald J. (1995b): "Can Power be Reduced to a Quantitative Index -- and If So, Which One? A Response to Garrett, McLean and Machover", British Journal of Political Science 25: 568-71.
Laruelle, Annick and Widgrén, Mika (1997): "Is the Allocation of Voting Power Among the EU States Fair?", Public Choice, 94: 317-39.
Leech, Dennis (2000): Power Relations in the International Monetary Fund: An Analysis of a Priori Voting Power Using the Theory of Simple Games, paper presented at the 41st Annual Meeting of the International Studies Association (ISA), Los Angeles, March 14-17, 2000.
Midgaard, Knut (1999): Schemes of Voting Weight Distributions in the EU: Possible and Actual Justifications, ARENA Working Paper, WP 99/25.
Moberg, Axel (1998): "The Voting System in the European Union: The Balance Between Large and Small Countries", Scandinavian Political Studies, 21, 4, 347-65.
Newcombe, Hanna, Wert, J. and Newcombe A. (1971): "Comparison of Weighted Voting Formulas for the United Nations", World Politics, 23, 3: 452-92.
Nicholson, Michael (1989): Formal Theories in International Relations. New York: Cambridge University Press.
Penrose, Lloyd S. (1946): "The Elementary Statistics of Majority Voting", Journal of the Royal Statistical Society, 109, 53-57.
Presidency Conclusions (1999), Cologne European Council 3 and 4 June. Cologne (04-06-1999) — Nr. 150/99.
Rapoport, Anatol (1970): N-Person Game Theory: Concepts and Applications. Ann Arbor: University of Michigan Press.
Revision of Maastricht (1996): Implementation and Proposals for Reform. A Survey of National Views (Fifth Bulletin, January-June 1996). The Hague: The Netherlands Institute of International Relations, Clingendael.
Schmitter, Philippe and Torreblanca, José I. (1997): Old ‘Foundations’ and New ‘Rules’ -- For an Enlarged European Union. (Manuscript)
Shapley, Lloyd S. and Shubik, Martin (1954): "A Method for Evaluating the Distribution of Power in a Committee System", American Political Science Review, 48, 787-792.
Soetendorp, Ben and Hosli, Madeleine (2000): Negotiations in the European Union: The Hidden Influence on Council Decision-Making, paper prepared for presentation at the 41st Annual Meeting of the International Studies Association (ISA), Los Angeles, March 14-17.
Strand, Jonathan R. (1999): "State Power in a Multilateral Context: Voting Strength in the Asian Development Bank", International Interactions, 25: 53-74.
Strand, Jonathan R. (2000): Institutional Design and Power Relations in the African Development Bank, paper paper presented at the 41st Annual Meeting of the International Studies Association (ISA), Los Angeles, March 14-17, 2000.
Taagepera Rein and Matthew S. Shugart (1989): Seats and Votes: The Effects and Determinants of Electoral Systems. New Haven and London: Yale University Press.
Van Deemen, Ad M.A. (1989): "Dominant Players and Minimum Size Coalitions", European Journal of Political Research, 17: 313-32.
Van Deemen, Ad M.A. (1997): Coalition Formation and Social Choice. Boston/Dordrecht: Kluwer.
Von Neumann, John and Morgenstern, Otto (1947): Theory of Games and Economic Behavior. Princeton, NJ: Princeton University Press.
Widgrén Mika (1994): "Voting Power in the EC Decision-Making and the Consequences of Two Different Enlargements", European Economic Review, 38, 1153-70.
Zamora, Stephen (1980): Voting in International Economic Organizations, American Journal of International Law, 74: 566-608.
Zbinden, Martin (1998): "Implications of the Intergovernmental Conference and the Treaty of Amsterdam for Small EU Member States", in Laurent Goetschel, ed., Small States Inside and Outside the European Union, Dordrecht: Kluwer, 207-41.
APPENDIX
This appendix will present models that have so far been developed to assess the distribution of voting weights in the Council of the EU. In addition, it provides information on ways to assess the extent of "efficiency" of a voting rule in a committee, members’ a priori voting power in it, and possible effects of a double-majority clause.
APPENDIX AFormulas to Assess the Distribution of Votes in the Council
Mika Widgrén (1994) derives the following formula for the distribution of votes in the Council as compared to population size:
where v denotes the number of votes and p a member’s population (measured in thousands). The t-value for this regression is 0.00009 and R2 = 0.972. (Hence, the model is able to explain a rather large variation in the dependent variable (v) and the results are highly significant.)
Berg and Lane (1996) use the following formula as a predictor of "assembly size" (here for the 1995 Council):
(Note that the cube root implies an exponent of 0.33). The respective regression applied to the distribution of votes in the Council generates R2 = 0.971 and is significant.
APPENDIX BThe "Efficiency" of Decision-Making
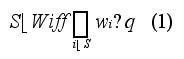
Generally, a weighted threshold game is a simple game in which a weight is assigned to each player. A coalition in such a game is winning if the sum of the weights of the members in the coalition is larger than or equal to the decision rule (the "quota" of the game). A weighted threshold game G is formally given by G = [q; w1, w2, ..., wn], with q denoting the decision quota and wi player i’s voting weight. In a weighted threshold game, a winning coalition satisfies the condition
Similarly, the requirement to form a "blocking minority" is that the sum of votes of the coalition members equals or exceeds the blocking minority threshold (but does not reach the quota for a qualified majority).
Formally, the existence of a winning coalition can be described in the framework of simple games 32 . Winning coalitions (W), more generally, have the power to control a game and to determine its outcomes 33 .
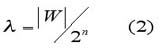
In a committee of size n, the total number of possible coalitions (combinations) among members, including the "grand coalition" and the empty set, is 2 n . Subsequently, the number of winning coalitions (here for the Council) will be denoted by | W|. When no restrictions on coalition-formation are introduced, the measure for relative "efficiency", l , can be calculated, according to Coleman (1971), as
Some easy examples may illustrate how the values for l are generated in practice. In the framework of a three-member voting body, let the players be labeled A, B, and C, respectively. Eight coalitions among these members are possible in practice (as 23 = 8): {A}, {B}, {C}, {A, B}, {A, C}, {B, C}, the "grand coalition" {A, B, C} and the empty set {f }. Depending on the relevant decision rule, however, only some of these coalitions are "winning coalitions".
For example, under the unanimity requirement, only the coalition that encompasses all members, the "grand coalition", {A, B, C}, can be winning. The weighted threshold game in this case is [3; 1,1,1]. If votes are non-weighted, in the framework of the simple majority rule -- here coinciding with the two-thirds majority requirement -- the coalitions {A, B}, {A, C}, {B, C} and {A,B,C} are winning (in this example, the weighted threshold game is given by [2; 1,1,1]). Under the unanimity rule, the share of winning coalitions in the total is hence one in eight, resulting in a figure on relative "efficiency" of 12.5 percent. Under the two-thirds rule, four out of eight coalitions are winning, generating a figure on relative efficiency of 50 percent. Hence, in the second example as compared to the first one, efficiency is more extensive and generally, an institution’s capacity to reach a decision can be expected to be larger with a lower decision threshold.
APPENDIX CQuantitative Measures of A Priori Voting Power
Power Indices
Voting weights are not equal to voting power. In addition, the voting threshold ("quota") significantly influences the distribution of a priori power in a committee. How can relative power be assessed?
A priori indices of voting power, in their more general forms, are not based on the assumption of specific preference constellations among actors in pre-defined policy areas. A helpful tool created a few decades ago, these indices aim at illustrating how institutions — especially in the framework of structures in which actors’ votes are weighted — may favor or disadvantage certain players. They indeed are a priori indices of power and should not be confused with assessing the "effective power" of actors in more specific situations for which information on preference distributions is available.
In a decision-making framework, a simple example can illustrate how voting power analysis may help to generate insights into the relative capacity of actors to influence policy results. Assume a voting body of three members in which the (simple) majority decision rule applies, and member A holds one vote, member B two votes and member C three. This weighted threshold game is formally denoted by G = [4; 1,2,3]. Trying to assess the relative influence of actors in this voting game leads one intuitively to think about possible coalition patterns: which coalitions can an actor participate in and how influential can it then be in the overall decision process? This is the starting point for the calculation of most power indices.
The Banzhaf Power Index 34 :
The characteristic function of a simple voting game assigns a value of 1 to player i when this actor is able to turn a losing coalition into a winning one and 0 when its vote does not matter for the fate of the coalition.
For example, the (normalized) Banzhaf index of power studies all possible coalitions (combinations) among members and assesses the proportion of "critical defections" -- those rendering the coalition losing when the member leaves -- in all critical defections that members can make. In the three-player game above, G = [4;1,2,3], the possible coalitions (combinations) among members, including the single-member coalitions (but excluding the empty coalition), are {A}, {B}, {C}, {A,B}, {A,C}, {B,C} and {A,B,C}. Only coalitions {A,C}, {B,C} and {A,B,C}, however, meet the required threshold. Member A can make a critical defection (denoted in italics above) in coalition {A,C}, B in coalition {B,C} and C in the coalitions {A,C}, {B,C} and the "grand coalition" {A,B,C) (as coalition {A,B} is no longer winning without C). This provides A with a relative voting power of one-fifth of the total, B with one-fifth, and C with three-fifth as assessed by the (normalized) Banzhaf power index.
In the framework of this index, every coalition among players is basically considered to have the same probability of occurrence (absent information on players’ preferences). A player is called marginal, swing, pivotal or critical if it is able to turn a losing coalition into winning (or vice versa) on the basis of its vote. The non-normalized Banzhaf index of voting power counts the number of respective "swings" for each player and compares them with the total number of feasible coalitions (combinations) among the players. Normalization of the index is derived by dividing the number of times player i is critical for the fate of a coalition by the sum of the critical defections for all players.
Formally, let h i be the number of winning coalitions in which player i is critical. The (normalized) Banzhaf power index for player i, denoted by b i, is then defined as
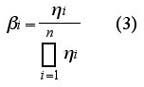
The Banzhaf vector of a game is the vector b = ( b 1, b 2,....., b n).
The Shapley-Shubik Index of Power 35 :
In the context of another widely used index, the Shapley-Shubik index, it is every possible ordering in which players can join a coalition that is considered to be relevant. This can be interpreted, in a more applied setting, in the sense that members may -- according to their location (or intensity) of preference -- join coalitions in sequence, with the "pivotal player" then turning a losing coalition into winning. The Shapley-Shubik index for player i is calculated as
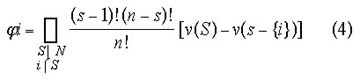
where s denotes the number of players in coalition S, n the total number of players in the player set N and [v(S) - v(S-{i})] the marginal contribution of player i to the coalition S. If player i is the pivot, v(S) = 0 (i Ï S), but v(S È i) = 1.
Hence, the Shapley-Shubik index of power respects the possible orderings in which members build a coalition. In the possible permutations among members in the weighted voting game G=[4;1,2,3] -- {A,B,C}, {A,C,B}, {B,A,C}, {B,C,A}, {C,A,B} and {C,B,A} -- the pivotal voter in the build-up process of the coalition -- the member whose vote turns the coalition from losing into winning -- is member C in the first, second, third and fourth coalition, member A in coalition five, and member B in coalition six (pivotal votes are again denoted in italics). Hence, the Shapley-Shubik power indices in this example are jA = 1/6, j B = 1/6 and j C = 2/3.
Both the (normalized) Banzhaf index of voting power and the Shapley-Shubik index hence account for the fact that member C, although its voting weight is not considerably larger than the one of member B, is more crucial within coalitions. In fact, by both indices, members A and B are found to hold equal voting power in this game, despite their differences in voting weight. There are various approaches in the power index tradition with respect to assumptions about how coalitions form, the relevant ordering of members and the resulting distribution of (expected) payoffs, especially whether the gains of the coalition are considered to constitute "private" or "public" goods 36 .
APPENDIX DDouble-majority rule:
Formally, as an extension of equation (2), the double-majority requirement is given by
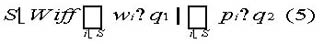
Applied to the Council of the EU, q1 may for example denote the (regular) QMV threshold, wi the number of votes of Council member i, pi member i’s share in the EU population total, and q2 the second quota (the threshold in terms of the required share in total EU population). Hence, winning coalitions in the Council under the double-majority clause, according to equation (5), require that both relevant decision quotas be met.
The voting power technique can hence be used to assess a priori voting power in the framework of a double-majority rule for the Council. Measuring the effects, for example on the basis of the (normalized) Banzhaf power index, requires an extension of the original formula (equation 3). It will be discussed below.
Assume, for example, that a double-majority decision needs to be taken in a committee in which the "one member, one vote" rule applies and in addition, decisions can only be made if supported by a predetermined majority of population as represented by the committee members. Player A’s population size is 20 percent of the total, B’s 30 percent and C’s 50 percent, and the required (second) threshold (q2) is 60 percent of total population. How should calculations proceed to assess relative power in this situation?
The following winning coalitions are possible that simultaneously meet the decision thresholds on both dimensions: {A,C}, {B,C}, and {A,B,C}. These coalitions are winning because they meet both the first quota (majority of members) and the second one (majority of population). Other coalitions are not successful on at least one dimension (a majority of votes or of population as represented by the players), but as we will see below, they may nonetheless matter for calculations. Coalition {A,B}, more specifically, meets the requirement with respect to quota 1 (as two out of three members are needed to support the proposal), but not with respect to quota 2. In the first two coalitions that are "successful" on both dimensions, if either player defects, the coalition is rendered losing (if defection is critical on both dimensions simultaneously, members essentially hold "double pivotal votes"). By comparison, in the "grand coalition" consisting of all three players, only if member C defects is the coalition rendered losing (on the basis of the population requirement), but it would still be large enough to meet the first threshold (a majority of the members).
Generally, double critical defections do not enhance the relative power of a member and will hence be subtracted from the total. That is, the power index for the double-majority clause needs to take the fact into account that a member’s de facto influence is not enhanced when it can cast a "double pivotal vote" (that is, when it can make a winning coalition lose with respect to both requirements, reaching a majority on the first and the second dimension) 37 .
Formally, if vi(S1) refers to the instances in which player i can make a critical defection with respect to reaching a majority on the first dimension, vi(S2) to a majority on the second dimension and vi(SD) denotes the "double pivotal votes," the normalized Banzhaf power index for the double-majority clause may be calculated as
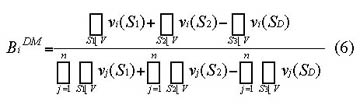
The voting power index for the double majority clause thus deducts the number of "double pivotal votes" in the nominator from the sum of critical defections for player i on either dimension. In order to normalize the index, this sum -- as in the case of the simpler index -- is subsequently divided by the sum of critical defections for all players (again corrected by the number of double pivotal votes).
Generally, the larger the share of double pivotal votes for a member as compared to its critical defections with respect to reaching a majority on either one of the two dimensions, the smaller is the effect on its voting power. For example, when members have an equal number of votes on the first dimension, whereas votes for the second dimension are "weighted" according to population size, larger states are likely to hold a comparatively larger proportion of "double pivotal votes", leading to a moderating effect on their relative voting power.
However, in the framework of a double-majority clause for the Council, essentially only the critical defections matter within winning coalitions that are meeting both quotas (according to formula 5). Hence, equation (6), in the analysis of this paper, will be restricted to instances in which winning coalitions are formed that are "successful" on both dimensions (a majority of the votes and a majority of the required EU population as represented in the Council). "Critical defections" on either of the two dimensions are then relevant.
In practice, the index to assess power under the double-majority scheme, as used in this paper, is then calculated as follows. In the double majority game G1=[2;111] and G2=[60;20,30,50], if only winning coalitions on both dimensions considered to matter de facto -- those coalitions meeting both decision requirements in accordance with formula (6) — player A will have an (overlapping) critical defection in the framework of coalition {A,C}. The same is true for player B in coalition {B,C}. C has one critical defection with respect to dimension two exclusively (in coalition {A,B,C}), but two overlapping critical defections in coalitions {A,C} and {B,C}. Voting power is thus calculated by adding the individual defections of players on either dimension, subtracting the number of double pivotal votes, and dividing this total by the respective number of "critical defections" for all players on either dimension (again corrected by the total number of double pivotal votes). For player A, the share in the total is then (1+1-1)/(4+5-4)=1/5. Relative voting power is the same for player B. By comparison, member C holds a relative voting power of (2+3-2)/(4+5-4)=3/5 of the total.
By comparison, in assessing the ability of members to prevent a winning coalition from forming, and hence their power to influence the formation of "blocking minorities", coalitions that meet the "blocking minority threshold" on a single dimension will also matter. Therefore, a "critical defection", in this situation, will also be counted and considered to be relevant when it only applies to one of the two dimensions (as respective members then have the capacity to turn a "losing coalition" into a "blocking minority" on that dimension, and prevent a qualified majority from being formed).
Accordingly, when the ability to affect the formation of a "blocking minority" is considered, members A and B are each attributed an additional "critical defection" in the framework of the example discussed above, as they each may prevent coalition {A,B} from forming ({A,B} is a "blocking coalition" on the first dimension). Player C can form the single-member coalition {C}, constituting a blocking minority with respect to the second quota (a majority of population). Voting power, in the framework of blocking coalitions, is then (2+1-1)/(6+5-4)=2/7 for both players A and B, and (2+3-2)/(6+5-4)=3/7 for player C.
Hence, players A and B, in this example, will benefit from the double-majority clause in terms of their ability to be essential to the formation of blocking coalitions, as the distribution of relative influence will then be in the proportion 2:2:3 (instead of 1:1:3 as in G1), but not with respect to attaining a qualified majority that meets the required thresholds on both dimensions (where relative a priori power will still be distributed in the proportion 1:1:3 between players A, B and C).
Endnotes
Note 1: The Cologne European Council, conducted on June 3-4, 1999, outlined three specific institutional challenges for the EU to be focused on in the upcoming IGC: (1) size and composition of the Commission; (2) weighting of votes in the Council (re-weighting, introduction of a dual majority rule, and threshold for qualified-majority decision-making); (3) a possible extension of qualified-majority voting in the Council. Also see Best (1999), p.1. The issues can be found under point 53 of the document Presidency Conclusions (1999). Back.
Note 2: A thorough analysis of these institutions can be found in Hayes-Renshaw and Wallace (1997). Back.
Note 3: For example, see Soetendorp and Hosli (2000). Back.
Note 4: In the analysis here, no specific distribution of preferences among EU states will be assumed to exist. Trying to do so would be difficult anyway, not only as regards decisions to be taken in the future, but also because it is generally unlikely that issues to be decided upon in the EU could be represented on a (simple) uni-dimensional policy scale. Working with a multidimensional scale certainly complicates matters considerably. Back.
Note 5: Although some models using the spatial theory of voting analyzing EU decision-making have so far generated interesting insights into strategy and inter-institutional interaction in the EU (usually, however, assuming that issues can be represented on a simple one-dimensional policy scale), it is certainly helpful in the case of the EU to take the fact serious that votes in the Council are weighted. Back.
Note 7: On the specific reasons for the definition of the quota in different constellations of membership and the relationship between the voting weights of larger and smaller members, see Moberg (1998), Midgaard (1999) and Best (1999).
See Moberg (1998). Back.Note 8: See Moberg (1998). Back.
Note 9: The figures provided here are slightly different from data presented, for example, in the document Presidency Conclusions (1999). The population figures used here are based on data collections by other organizations apart from Eurostat, including the United Nations Statistical Yearbook and the World Bank World Tables. Back.
Note 10: Lorenz curves graphically illustrate the cumulative shares of two variables in the total as compared to a proportional relationship. They are, for example, particularly useful in displaying the structure of income distribution among citizens in a country (with the share in population shown on one axis and the share in income on the other), or an overview of shares of votes received in elections as compared to seats obtained in a national parliament. The degree of inequality can subsequently be expressed by the Gini-index (in a two-dimensional setup, the Gini-index measures the size of the area between the resulting Lorenz curve and the proportional 45-degree line). Back.
Note 11: A Gini-Index of 0 would indicate that the distribution would be purely proportional. Back.
Note 12: On this, see Best (1999). Back.
Note 13: This variable is, for instance, used to allocate voting weights in the International Monetary Fund (IMF). On voting weights in different international institutions and organizations, see Zamora (1980). Midgaard (1999) considers this option to be of limited applicability to the EU. Different weighting formulas as suggested for the United Nations General Assembly are discussed in Newcombe, Wert and Newcombe (1971) and Dixon (1983). Back.
Note 14: Figures for this proposal are also discussed in Moberg (1998) and Best (1999). The figures are displayed for both the 15-member EU and the scenario "EU 26" in Annex 1 to Best (1999). Back.
Note 15: Knut Midgaard (1999) illustrates that the "Dutch proposal" is rather close to an extrapolation of the distribution of votes in the first constellation of Community membership, but with an adaptation for the votes of the largest members: whereas allocation among the six first members was on the basis of the distribution (1,2,4), an extrapolation on the basis of (1,2,5) would get figures that are rather close to the 1997 proposal of the Dutch Presidency. Back.
Note 16: On this option, see Schmitter and Torreblanca (1997) and Moberg (1998). Back.
Note 17: The measure that will be used here is Coleman’s analysis of the power of a collectivity to act. See Coleman (1971); Leech (2000). Back.
Note 18: As mentioned above, the approach presented here will not attempt to take inter-institutional relations in the EU into account. For situations in which information on preferences is more readily available, it is not excluded that the two approaches may be combined. On the properties and relative merits of different techniques, see Holler and Widgrén (1999) or Berg and Lane(1999). Back.
Note 19: Other applications using such indices in an analysis of international institutions include Strand (1999), Strand and Rapkin (1999), Strand (2000) and Leech (2000). Dennis Leech appears to give preference to the normalized Banzhaf index is his study, whereas Jonathan Strand appears to be slightly inclined to use the Johnston index. Back.
Note 20: For such an endeavor, see especially Laruelle and Widgrén (1997). Back.
Note 21: If member’s preferences on decisions can be displayed on a one-dimensional policy scale, the share of potential winning coalitions in the total will be more constant with either enlargement or an increase in the voting threshold. Back.
Note 22: See Hosli (1998).Back.
Note 23: For studies analyzing the capacity of EU members to affect the fate of blocking coalitions — especially in the framework of the "Ioannina compromise" as compared to the regular current decision threshold — see especially Johnston (1995a, 1995b). Back.
Note 24: Assessments made here essentially assume that representatives of all relevant actors are present at the time of the vote. This most likely is a reasonable provision when studying decision-making in the Council (or COREPER). Quite evidently, analyses along these lines are likely to be most relevant when applied to decisions in the framework of the EU’s Pillar I. Back.
Note 25: Although in the extrapolation of table 5, two votes were given to Estonia and Slovenia, we will here assume that they obtain 3 votes, in accordance with the figures presented in Council of the European Union (1999). Back.
Note 26: It will here be the normalized Banzhaf index of power. Back.
Note 27: Under these relatively simple voting schemes (where a majority is required on one "dimension"), members’ capacity to affect the fate of coalitions that reach the qualified majority threshold will be rather similar to their potential to influence blocking coalitions. This will be important when comparing effects later in this study with consequences of a possible double-majority clause. Back.
Note 28: For an analysis of the effects of introducing a double-majority rule on members’ relative voting power -- also for the option of a double-majority clause implying a "one member, one vote" rule in the Council in addition to a population requirement -- see Hosli (1995). Back.
Note 29: For example, see Revision of Maastricht (1996), European Parliament (1997) and Moberg (1998). Back.
Note 30: See Presidency Conclusions (1999) and Council of the European Union (1999), respectively. Back.
Note 31: It is noted in this document, however, that vote allocations are given on the basis of linear extrapolations as they were reported during the Amsterdam IGC (see doc CONF/3815/97), and with the addition of Malta. Population figures for most states listed were for 1997 (but for 1996 or 1995 for some members). Back.
Note 32: The following definitions go back to the seminal work of Von Neumann and Morgenstern (1947). On relevant concepts and definitions in this framework, see van Deemen (1989 and 1997). A simple game is an ordered pair of sets G=(N,W), where N denotes the player set and W is a set of coalitions (or subsets of N). An element of W is called a winning coalition. The following axioms apply with respect to winning coalitions: (1) any coalition which contains a winning subcoalition is itself winning; formally, if S Î W and S Í T, then T Î W (monotonicity requirement); (2) there are winning coalitions: W ¹ Æ ; (3) the empty coalition is not winning (Æ ¹ W). Axioms (2) and (3) ensure that trivial games are excluded. Back.
Note 33: On simple games and legislatures more generally see, for instance, Rapoport (1970: 207-21). Back.
Note 34: Banzhaf (1965). Cf. Penrose (1946). Back.
Note 35: Shapley and Shubik (1954). Back.
Note 36: For a helpful overview of different indices and applications, see Holler (1981) and the various contributions therein. On the "public good index", see for example Holler (1998). Back.
Note 37: The logic of this assumption can be illustrated by an explanation of Nicholson (1989: 57) with respect to the formula P(AÈ B)=P(A)+P(B)-P(AÇ B): "Taking away the last term is necessary as it is contained in both P(A) and P(B) and would be otherwise double counted. An example of this is when a gamble is offered in which the prize is paid if a head comes up in either of two separate throws of a coin. The probability of winning is thus _ + _ - _ x _ = _, which is the probability of each of the heads coming up separately minus the probability of them both coming up, in which case one of them is redundant as far as contributing towards success." Back.