|
|
|
|
Dilemmas of Reform in Jiang Zemin’s China, by Andrew J. Nathan, Zhaohui Hong, and Steven R. Smith (eds.)
11. China’s Economic Prospects in the New Century 1
Perhaps the most striking development that economic history has so far experienced is the rapid growth of the Chinese economy that has extended over almost two decades in a country where more than one-fifth of the world’s population resides. A sustainable growing economy is a necessity for China’s future stability. The growth sustainability of the Chinese economy depends essentially on its continued commitments to institutional reform and economic deregulation. China’s relaxation of government intervention in economic activities has led and will be leading China to decentralize its central governmental authority over economic planning and control. This will consequently stimulate the emergence of regional economies in Mainland China. In the next two decades, there will likely be ten regional economies with relatively independent industrial structures emerging in Greater China as a result of economic decentralization. 2 In this chapter, we present our analysis of and predictions on China’s economic future in the new century. We believe that regionalization is not only an emerging trend of China’s economic development, but also a controllable process that may be accelerated by proper development policies. Regionalization is indeed the best strategy for China’s economic future.
If the Chinese central authority follows the laws of the free market and leaves the regional economy intact, the Chinese regional economies are likely to generate robust and endurable productivity advancement, which will prolong China’s current rapid growth into the first two decades of the next century. China’s neighbor economies, Taiwan, Hong Kong, and Macao, may also contribute to and benefit from this anticipated trend of economic regionalization if they integrate their industrial structures and economic markets with the mainland’s economic regions. Should this happen, there will likely emerge four new regional economies—Taiwan-Fujian, Hong Kong–Guangdong, Greater Shanghai, and south-central China—which by the twenty-first century will have surpassed South Korea’s economic scale and become the new Asian Tigers.
To explore this prediction, we first depict China’s economic growth up to 2020 according to three alternative scenarios: the high-growth potential based on the policy regime of economic deregulation and decentralization, the stable-growth potential based on an extrapolation of China’s current policies and trends, and the low-growth scenario postulated on a reversion to an authoritarian socialist government. Under the stable-growth scenario, China will progress along the lines of gradualism by “groping for stones on which to cross the river.” This will enable the Chinese economy to grow at a compound annual rate of 5.8 percent between 1997 and 2020. Under the socialist hard-liner postulation, the Chinese economy will grow more slowly at an annual rate of 4.3 percent in the same period. If China speeds up its efforts toward economic deregulation and decentralization, China will achieve its high-growth potential at an annual rate of 7.4 percent up to 2020. Should this take place, by 2020 an average Chinese mainlander will enjoy a living standard as high as that of Taiwan’s residents at present.
After examining various limitations on China’s future growth, we believe regionalization is indeed the probable trend that the vast Chinese economy will follow. Following this revealing trend, we proceed to examine the emerging regional economies within Greater China and conclude by presenting a regional economic integration strategy for the three apparently related but somehow independent economies: Taiwan, Hong Kong and Macao, and Mainland China. We believe that an integration strategy may actually benefit them all.
A Retrospective of China’s Economic Prosperity
Since 1978, China has been transforming its economy through two lengthy processes of structural changes: industrialization and marketization. Industrialization has been transforming a rural agricultural society into an urban industrial one. In addition, efforts to adopt market mechanisms for all levels of decisionmaking have greatly been diminishing China’s authoritarian command economy. These two major structural changes have generated tremendous productivity advancement, stimulating the Chinese economy to grow at an unprecedented speed.
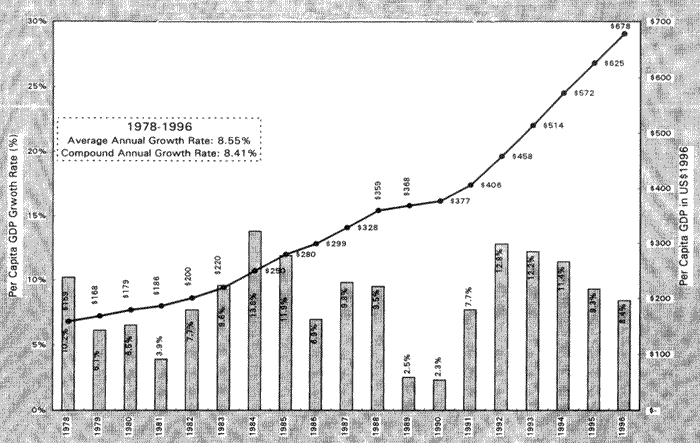
China’s average gross domestic product (GDP) growth of 9.7 percent per annum between 1978 and 1996 has been characterized by an unusually high savings rate of over 37 percent, a doubling of consumption, a 60 percent decline in the poverty rate (170 million of the 270 million Chinese living in absolute poverty were raised above the minimum poverty threshold), a decline in the infant mortality rate from 48 to 35 per 1,000 live births, and an increase in life expectancy to seventy-one years. 3 China’s per capita GDP grew, on average, 8.4 percent a year from 1978 to 1996 (see Figure 11.1). 4 Although other studies show that official statistics may overstate the annual economic performance by as much as 1–1.5 percent, 5 alternative estimated growth rates still rank China together with Taiwan and South Korea as the three fastest-growing economies in the world. However, even with miraculous rates of growth, by the end of 1996 an average Chinese merely earned an income (GDP per capita) of US$678, which places China among the low-income countries in the world. 6
Even if lower domestic price levels were taken into account, China’s per capita GDP, after adjusting for international prices (i.e., the Purchasing Power Parity equivalence, or PPP), was about US$3,865 in 1986. That amount was about the same as Indonesia’s. In 1996, Taiwan and South Korea had GDPs per capita (PPP) of US$14,295 and US$11,750, respectively. 7
Economic Attributes
In 1978, after years of state control over all productive assets, the government embarked on a major program of economic reform, which stressed rapid structural changes. It encouraged privatization of agricultural production, formation of rural enterprises and private businesses, liberalization of foreign trade and investment regulations, relaxation of state control over some prices, and investment in industrial production and the education of its workforce. Though characterized by gradualism and experimentation, this reform strategy, which has emphasized decentralization, reliance on market forces, and openness to trade and foreign investment, has worked spectacularly well.
Throughout the 1970s and 1980s, agriculture reforms, such as privatization through the household responsibility system, allowed agricultural prices to increase to market prices and allowed production controls to relax, which in turn substantially increased rural income. It has been estimated that the privatization of agricultural production contributed nearly half of the growth in agricultural outputs between 1978 and 1984. 8 By the end of 1984, over 99 percent of Chinese farmers had adapted to the household responsibility system. Higher rural incomes generated markets for consumer goods and services that required relatively little advanced technology and capital to produce. The reforms also boosted agricultural productivity, freeing a huge volume of agrarian labor previously engaged in the commune system for industrial development. More important, institutional changes in government procurement policies on agricultural materials and rural industrial products led to a boom in rural industry. For example, in 1988 rural enterprises accounted for about 36 percent of industrial output.
Three major reforms opened China’s economy to the world. First, in the early 1980s, the Chinese government first ended the state-owned trade companies’ monopoly on international trade and gradually lifted control of export products. Second, control over foreign exchange was also gradually relaxed: exporters were allowed to retain a portion of their foreign exchange from trading, and individuals were given some freedom to hold foreign currencies. Third, the government eased its intervention in foreign direct investment.
These three reforms have resulted in the rapid growth of foreign trade as well as in sharp increases in foreign direct investment, mostly in specially designated zones located in the nine coastal provinces. Foreign companies (including those invested in by overseas Chinese from Taiwan, Hong Kong, and all other parts of the world) have contributed not only financial capital, but also advanced technology as well as feasible (e.g., modern labor-intensive) production specialty, commercial expertise and management know-how, connections to foreign markets, and entrepreneurship. China’s customs statistics show that 46.9 percent (US$152.6 billion) of China’s total merchandise trade in 1997 was through foreign-investment enterprises (including joint ventures).
Figure 11.1: China’s Economic Growth: 1978-1996
GDP per Capita in 1996 US$ and Annual Rate of Growth (%)
Noneconomic Attributes
Four noneconomic, exogenous factors have generated unusually strong impetuses to the economy and have distinguished China’s economic growth from that of Latin American, East European, and Southeast Asian countries: (1) a relatively stable political and social environment, (2) sustained high savings, (3) effective reform policies with powerful administrative authority, and (4) the supportive international environment.
Relatively stable political and social environment. During the “open-door and reform” period, China has experienced a relatively stable political environment, free from political and social disorder. Nevertheless, in the 1980–1981 period, when the power base of Hua Guofeng, Mao’s personally picked successor, diminished rapidly and was replaced by the regime of Hu Yaobun and Zhao Ziyang, the change was accompanied by a policy vacuum and political uncertainty. This political instability, compounded with the Sino-Vietnam border war and its aftermath, was the main reason for the economic downturn in 1981, when economic growth decreased by 40 percent from the previous year’s 6.5 percent. Nearly a decade later, the 1989 student uprising and its aftermath resulted in two years of low growth in 1989 and 1990 (see Figure 11.1); however, they also helped cool down the otherwise uncontrollable inflation that had persisted for years prior to the 1989 Tiananmen incident.
China has, on the whole, experienced nearly twenty years of stable political and social development, which is indeed extraordinary, compared with the thirty-year history prior to the reform and open-door era. Except for the 1980–1981 and the 1989–1990 political impediments, political and social stability has provided a solid foundation for economic growth in the 1980s and 1990s.
Sustained high savings. Before 1978, under strict central planning, the government obtained most savings by maintaining agricultural and raw materials prices at artificially low levels and setting arbitrarily high prices for certain goods. The planning authorities for investment and capital accumulation then commandeered these profits. Low wages and high-priced consumer goods held down personal savings. Between 1965 and 1978, when national savings remained, as planned, at 33 percent of GDP, household savings on average accounted for merely 1 percent of the GDP.
Since the start of the reform era, household savings have risen to 21 percent of the GDP. By the mid-1990s, households had contributed about half of the total national savings. State-owned enterprises together with privately and jointly owned enterprises now contribute the other half of the national savings. 9
Effective reform policies and governing system. The most direct exogenous impetus that has caused the Chinese economy to grow swiftly must have been those often unerring but also highly pragmatic development policies. However, successful development policies alone would not have sufficed if the Chinese government had not had strong leadership, firm determination, and powerful administrative authority to implement those policies. Nevertheless, China’s governmental system did have a nondemocratic, top-down command system, resulting in endemic low productivity and inefficiency. It was highly bureaucratic and authoritative, discretionary and secret, politically oriented and prejudiced, and so on. The Chinese Communist Party (CCP) continues to play a vital role in all levels of public administration without democratic approval. Therefore, the success of the authorities in implementing efficient and effective policies ought to be viewed as being offset by the sacrifice of democracy, freedom, and human rights.
This sacrifice has allowed the central authority to use highly selective taxation policies and often-discriminatory regional development policies with minimum resistance. The authority has also allowed the regime to carry out major reform policies with no legislative restraint. In addition, the CCP’s power over the police and military forces has ensured a stable political and social environment that has provided the foundation for rapid economic growth.
The supportive world environment. In the early 1980s, when China began economic reform, the Western world, together with international organizations such as the United Nations and the World Bank, provided financial and nonfinancial aid to support the reform. By the end of 1996, foreign capital inflows (loans plus investments) accumulated to a total of US$283.9 billion (since 1983).
In addition, China has attracted more foreign direct investment than any country in the world except the United States. With its special economic zones, coastal cities, and inland areas as favored locations for private foreign investment, China’s foreign direct investment grew from US$1.8 billion in 1984 to US$41.7 billion in 1996. Investments from major multinational firms and, to a larger extent, from the Chinese diaspora also contributed to the Chinese economy by bringing in management know-how and international market connections.
China’s Economic Prospects
China’s Official Economic Plans
China’s official development plans, the Ninth Five-Year Plan (1996–2000) and the Fifteen-Year Perspective Plan (1996–2010), outline an explicit short-term target of an average annual real GDP growth of 8 percent through the period of 1996 to 2000 and a long-term growth prospect of 7 percent a year up to 2020. The Ninth Five-Year Plan also calls for fiscal and financial sector reforms and macroeconomic spending restraints to curtail inflationary pressures. Except for laying out quantitative growth targets, these plans also unambiguously prescribe institutional reform objectives and targets. The plans call for growth by transforming past growth (mainly driven by input increases) into future intensive growth by improving efficiency through the advancement of science and technology. This advancement would be achieved by:
Gradually reforming state-owned enterprises (SOEs): the largest thousand SOEs will be reformed before the whole sector of SOEs is further reformed;
Developing social welfare and human resources by: (a) eliminating poverty by the year 2000 through economic growth and public expenditures (transfer payments to poor areas); (b) establishing primary health care systems on a provincial basis and expanding coverage of social security benefits; and (c) extending nine-year compulsory education to all children; and
Reinforcing agricultural infrastructure investment, land reform, and research and technology to improve the production of grain, cotton, and oilseed.
The World Bank’s Prediction
With the aid of a multisector, neoclassic growth model, the World Bank’s study of China’s long-term economic growth suggests an average annual growth of 6.6 percent over the period of 1996 to 2020. 10 This predicted rate of growth is about 0.6 percent per year lower than China’s official plan over the same period of twenty-five years. This prediction extrapolates China’s past growth experience into the future. The World Bank’s study also provides many model-estimated or model-simulated economic parameters that are invaluable in appraising growth potential. Table 11.1 lists the World Bank’s simulation of China’s long-term growth potentials that are based on alternative combinations of savings rates and productivity growth. An annual savings rate of 40 percent, combined with a high productivity advancement of 2 percent a year, may produce an annual economic growth of 7.9 percent. On the other hand, a relatively low annual savings rate of 20 percent, together with a low productivity growth of 1 percent a year, will result in an annual growth of 4.2 percent.
|
Table 11.1: China’s Long-Term Economic Growth Potentials (Annual Percentage GDP Growth) |
||||
| Total factor productivity growth | ||||
| 1.0% | 1.5% | 2.0% | ||
| 20% | 4.2% | 4.9% | 5.5% | |
| Savings- | 25% | 4.8% | 5.5% | 6.4% |
| GDP | 30% | 5.4% | 6.1% | 7.2% |
| ratio | 35% | 5.9% | 6.6% | 7.6% |
| 40% | 6.4% | 7.2% | 7.9% | |
| Source: World Bank, China 2020: Development in the New Century (Washington, DC: World Bank, 1997). | ||||
The above simulated growth potentials are based on the World Bank’s multisector Solow growth model. Its parameters are summarized in Table 11.2. The model contains three sectors: agriculture, industry, and services. Each sector is assumed to have a constant-returns-to-scale production function with fixed factor input, two variable factor inputs of capital and labor, and a variable input of intermediate goods. Unity elasticity of substitution between factor inputs and intermediates, together with perfect competition in all markets, are also assumed. These assumptions essentially qualify the adopted production technology as one for the long run. Goods and services are either used as intermediates in the production of other goods and services, or for final consumption and investment.
| Table 11.2: The World Bank’s Long-Run Growth Model for China: Parameters | ||||
| Agriculture | Industry | Services | ||
| Output elasticity | Fixed factor | .10 | .0 | .0 |
| Capital | .20 | .20 | .27 | |
| Labor | .34 | .09 | .24 | |
| Intermediates | .36 | .71 | .49 | |
| Intermediate elasticity | Agriculture | .39 | .10 | .30 |
| Industry | .44 | .72 | .56 | |
| Services | .17 | .19 | .42 | |
| Investment shares | .04 | .88 | .08 | |
| Consumption shares | .25 | .35 | .40 | |
| Source: World Bank, China 2020 (DC: World Bank, 1997). | ||||
On the consumption side, household aggregate demands for goods and services are derived from maximizing a constant-elasticity-of-substitution (CES) utility function of all the final goods and services subject to the budget constraint of total output minus total savings. The demand for investment goods is also assumed as a CES technology of individual investment goods subject to the budget constraint of aggregate savings. With further assumptions of initial conditions and friction in the labor market, the World Bank team managed to obtain the parameters shown in Table 11.2.
China’s Growth Potentials
Based on the prescribed World Bank long-run, steady-state, multisector growth model, we can further simulate China’s future growth potentials by employing several qualitative assumptions. These assumptions include potential demographic changes (refer to Figure 11.4, p. 184), pace and depth of institutional reforms, degree of decentralization and progress of regionalization, productivity advancement, savings rates, and the international business environment (e.g., membership of the World Trade Organization). These assumptions can be used to generate three possible regimes of development policies that may be adopted for China’s economic growth up to the year 2020. The scenarios are based upon the following general presumptfions for the entire forecasting horizon up to 2020: there will be no large-scale conflicts or severe impediments in world trade and investment systems, international affairs will be conducted as usual under the rulings of the United Nations and the World Trade Organization, and China’s social and political environments will be stable.
The stable-growth scenario. If Beijing’s authority maintains the current pace in its pragmatic approach to future economic development (i.e., if the central authority gradually decentralizes its power over economic affairs and incrementally relaxes its interventions and controls over markets as observed in the reform era of the 1980s and early 1990s), the economy will grow steadily at a compound annual rate of 5.8 percent through the next twenty-four years (1997–2020). The growth path under this scenario is illustrated as the stable-growth scenario in Figures 11.2 and 11.3.
Under this “business as usual” scenario, the economy will produce US$3,137 billion (at 1996 price levels and exchange rates) in goods and services annually by 2020; or equivalently, the size of the Chinese economy will grow to 3.9 times of that of 1996. Because the population will also grow during this period (refer to Figure 11.4), the GDP per capita will be expected to grow at a compound rate of 4.9 percent a year. This will enable an average citizen to earn an annual income of US$2,153 at 1996 price levels in 2020. If the relativity of China’s prices and international prices remains unchanged, China will have a GDP per capita of US$10,136 at 1996 Purchasing Power Parity. This average income will be about the same as Malaysia’s or about 86 percent of South Korea’s in 1996. 11
The low-growth scenario. If China reverts to authoritarian central planning with intense government intervention, if it alters its reform and open-door progrowth policies, or if the CCP has to, for political reasons, reinforce strict socialist philosophy and policies, China’s economy will grow at a much slower pace of 4.3 percent a year between 1998 and 2020. This “socialist hard-liner” scenario will retard the market mechanism and result in the inefficient allocation of resources and high economic transaction costs throughout the whole economy.
Under this scenario, people’s propensities to work and to save will largely deteriorate and both domestic and international investment will be reduced. The economy will probably only experience a basic growth that is primarily generated by population growth and the slow accumulation of domestic capital. Consequently, by 2020, China’s economic scale will merely be 2.7 times that in 1996 (refer to the low-growth path in Figures 11.2 and 11.3), or will only be two-thirds of that under the stable-growth scenario. The average person will earn about US$1,509 a year (at 1996 price levels) in 2020, or equivalently, US$7,104 at 1996 PPP. This income level will be about the same as the Mexicans’ in 1996.
Figure 11.2a China’s Economic Growth Prospects: 1997-2020
Growth in Real GDP (%)
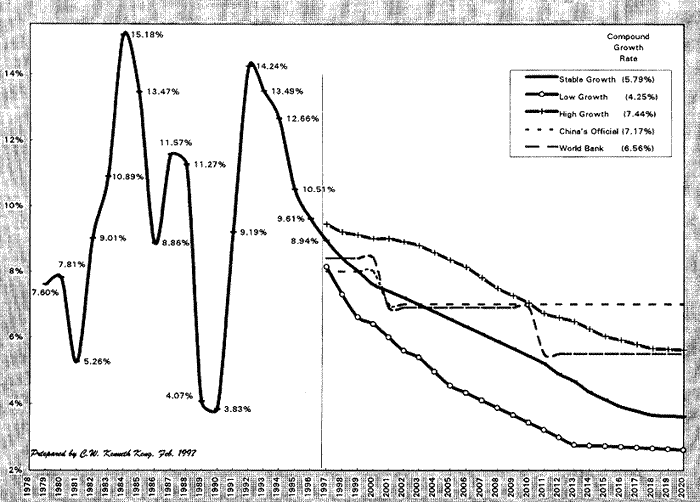
Figure 11.2b China’s Economic Growth Prospects: 1997-2020
Growth in Real GDP per Capita(%)
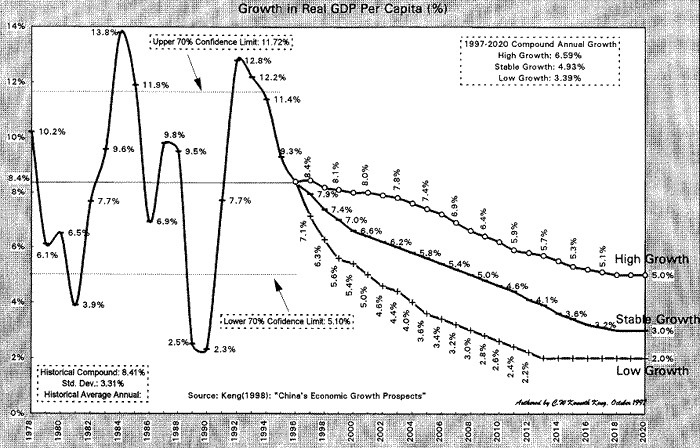
Figure 11.3 China’s GDP Growth Potentials 1997-2020
GDP in US$Billion 1996 Prices
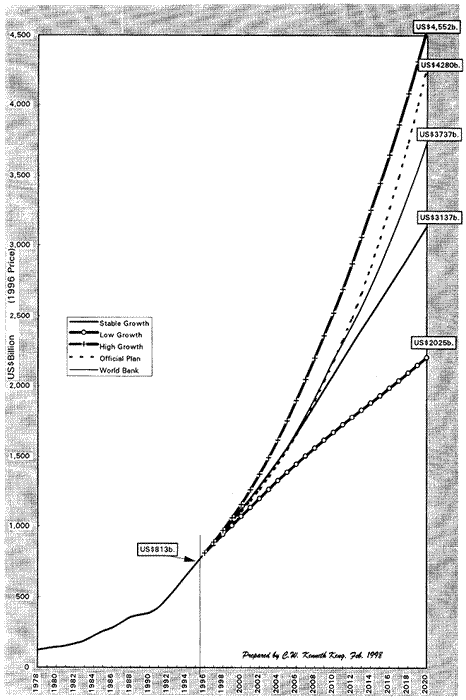
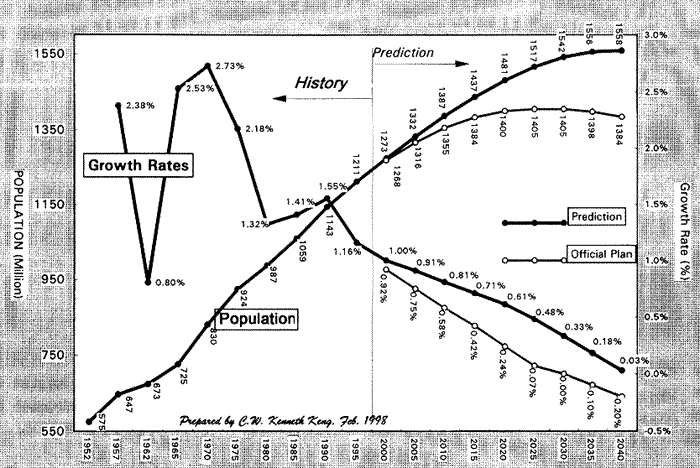
Figure 11.4 China’s Population Growth Potentials 1952-2040
The high-growth scenario. The high-growth scenario postulates that, in the next decade, China will speed up institutional reforms and relax most of its central government intervention in regional economic affairs. Under this policy regime, China’s economy will grow at an average rate of over 7.4 percent per annum up to 2020 (refer to the high-growth path in Figures 11.2 and 11.3). This would make the Chinese economy 5.6 times as large as it was in 1996. The total value of goods and services produced in 2020 will reach US$4,552 billion computed at the 1996 price level. Or equivalently, the GDP per capita in 2020 will reach US$3,133 at 1996 price levels, or US$14,752 at the 1996 PPP. This personal income level will even be slightly higher than Taiwan’s US$14,295 in 1996. If China further intensifies institutional reform and continues to open its markets, market forces, scale-economy impetus, and industry-structural optimization will continue to accelerate regionalization and productivity advancements. By 2020, China will be in the process of becoming one of the world’s largest industrialized economies with an average living standard similar to that enjoyed by Taiwan today.
In order to build up internationally competitive industries for international exchanges for adequate food, materials, and energy resources to sustain a rapidly growing economy, China will have to accelerate its globalization process to accommodate a more liberal division of production, better capital movement, and freer international trade. This “decentralization and deregulation” policy regime provides China with an optimistic view of having a sustained growing economy in the future. Decentralization and regionalization will also create a free environment for interregional exchanges and competition. Regional economies with relatively independent industrial structures will emerge rapidly as a result of scale economy and market perfection. Free regional markets and competitive regional industries will attract more international investment and technology transfers. Meanwhile, the different regions will also invest abroad to secure their international sources of energy and materials as well as to sustain international markets for their products. These will lead to a more efficient use of capital and labor at lower transaction costs than in other scenarios. Market competition will guide resources to their optimal allocations with minimum transaction costs. Interregional competition will therefore ensure the best possible economic growth for the economy as a whole.
Under this scenario, China will enjoy high degrees of market openness and division of production. It will not only attract more overseas commercial investment, but will also likely induce Hong Kong and Taiwan to accelerate their economic integration with Chinese regions at large, and with the neighboring regions of the Pearl River Delta (Guangdong) and Fujian in particular. Since the industries of these two regions are already export-oriented and have been primarily based on investments from Taiwan and Hong Kong, it would be easy (in terms of transaction costs) for Taiwan and Hong Kong to optimize their production division by reallocating their existing and new production capacities to Guangdong and Fujian. To a large extent, Hong Kong’s and Taiwan’s capital, technology, commercial services, and managerial know-how will fuel Guangdong’s and Fujian’s economic development. These four regional economies will be in a much better position to integrate their industrial structures, capital and labor utilization, and market scale to attain maximum economic benefit.
Alternative Predictions and Probability Assessment
As shown in Figure 11.2a, the World Bank’s prediction of China’s future economic growth is, on average, about 0.78 percent higher than our prediction under the stable-growth scenario, and China’s official plan is, on average, about 1.72 percent higher than ours. While, as indicated clearly in its report, the World Bank’s prediction is an extrapolation based on China’s past growth experience (mainly in the 1980s and the early 1990s), it did not incorporate qualitative information such as the extent of institutional reforms. However, the World Bank’s study does provide many model-estimated or -simulated economic parameters, invaluable in appraising China’s growth potentials.
Accounting for all possible outcomes and based on simulations using those parameters generated by the World Bank’s model, our results show that the probability of China’s future economic growth being between the high-growth and low-growth scenarios is about 80 percent. In other words, there is a 10 percent chance that China’s future growth will either exceed the high-growth path or fall below the low-growth path. Accounting for uncertainties, the trend of China’s economic growth in the next quarter century will most likely, with an 80 percent degree of confidence, fall in the range between our high-growth and low-growth predictions. In effect, our stable-growth scenario can be thought of as a representative prediction (the most likely forecast) of China’s future growth potentials.
Limitations to China’s Economic Growth
China has more than 20 percent of the world’s population but only 7 percent of the world’s arable land. In terms of a per capita resource base, China is among the most poorly endowed countries in the world. The 1992 World Bank study shows that China’s per capita agricultural land is 28 percent of the world’s average; range lands per capita are less than half the world’s average, and forests and wilderness areas per capita are 15 percent of the world’s average. 12 In addition, China’s water resources are about one-third the world’s average, and energy resources including coal on a per capita basis are also low.
This lack of natural resources could severely limit economic growth and welfare improvements if a more efficient use of resources and better production technology are not adopted. Although less government intervention, internationalization of markets, and globalization of industrial structures would enable China to resolve many of these natural-resource constraints by engaging in an international exchange of goods and services and a global division of production, 13 the relatively low per capita endowment of plains geography poses a critical limitation on China’s future economic growth.
When demand for urban land rises with increasing urbanization and industrialization, land prices tend to rise relative to other prices. High costs together with government regulations (e.g., real estate property rights) on urban land use will impede the effort to build a national transportation system of highways and railroads with an even moderate capacity for interregional transportation. The limited supply of land for urban and rural housing, commerce, and industry will thus be a crucial physical limitation to China’s economic development. The high cost of using land will be a crucial challenge to China’s capital productivity and international competitiveness. Interested readers are referred to Tables 11.6–11.8 at the end of this chapter for a concise discussion of China’s limitation on growth: the shortage of plains.
The low per capita endowment of plains areas will compel China to diversify its national economy into regional ones. Each of them will have its own relatively independent industrial structures and market system, so that the need for cross-regional long-distance land transportation will be reduced and the use of the scarce plains for transit systems will also be decreased. In this way, transportation costs, which constitute a major portion of the transaction costs of almost all economic activities, can be minimized. The economy as a whole will therefore use fewer resources for transportation to produce the same level of outputs; hence, macroeconomic productivity gains will be enjoyed. As a matter of fact, had there been no central planning and had China relied completely on market forces to allocate its resources, regionalization would have been the natural outcome.
Along this line of thought, the China State Planning Commission (SPC) study on regional and industrial development concludes that China will have to adopt Japan’s model of regionalization of industrial structures so that the use of long-range transportation corridors can be economized. 14 The SPC study also calls for establishing metropolitan economies (an economic region centered in large metropolises and surrounded by scattered cities) so that the plains can be utilized intensively. These metropolises, connected with surrounding satellite cities, will form an urban net on which a multisector industrial system can be developed. Ideally, the metropolitan areas will be the regional centers of industries and services, while satellite cities may house specific industries. The regional industrial structure will be formed (under market mechanisms) so that a major portion of goods and services produced in the region can be consumed within the region; as a result, the need for long-range interregional transportation can be reduced.
Emerging Chinese Regional Economies
Considering China’s history, geographic-economic characteristics, and the current status of regional economic development, many believe that in the first decade of the twenty-first century at least nine regional economies will emerge in Mainland China. 15 The emergence of these regional economies may be partly attributed to economic decentralization and market deregulation. Under market mechanisms, resources tend to be intensively utilized by being allocated toward urban centers where infrastructure and business services provide economic units with comparative advantages (lower transaction costs). As a result, regional markets and industrial systems, each with a network of geo-economic affiliated cities, will emerge and become relatively independent. This process of regionalization is essentially what Japan has experienced in the last thirty years.
The Trend Toward Economic Regionalization
To maintain economic growth, China needs to advance its industrial structure and economic efficiency as rapidly as possible so that its relatively limited natural resources (on a per capita basis) may be utilized to the maximum extent. To meet the demands of a future with an expected population of over 1.5 billion by 2020, China needs to perfect its manufacturing capacity and raise its productivity so that it can afford to import grains, raw materials, oil, capital equipment, advanced technology, and so on. Because of transportation costs (transit infrastructure construction and shipping costs), limited petroleum resources, and inadequate plains for building land transit systems and urbanization, China cannot rely on a singular national division of production, but instead must focus on regional systems of production and consumption. Regional economic development must then be a national priority for economic growth.
Traditionally, large portions of agricultural goods and services have been produced and consumed within regions. A World Bank study indicates that in the early 1990s, more than two-thirds of China’s agricultural products were consumed within the local counties and towns where they had been produced. 16 Another study shows that even in 1994, interregional economic activities between neighboring regions were surprisingly small. Using railway shipments as a measure, for example, only 10 percent of Liaoning’s shipments were to and from the neighboring Capital region—consisting of Beijing, Tianjin, and the whole province of Hebei—and the Shandong region across the Bohai Bay; and less than 12 percent of Shandong’s interregional shipments were to and from the Capital and Liaoning regions. These three neighboring regions around the bay area of the Bohai Sea consist of large economies (Shandong and the Capital region’s population is over 85 million, and Liaoning’s exceeds 40 million) with adequate natural resources. Each has developed its own relatively independent industrial structure and its own market. Needs for interregional shipments of industrial goods are relatively small. 17 In other words, due to the structures of industries and markets, the Bohai Bay area in effect consists of three relatively independent economic regions.
On the development-policy side, the central government has delegated more power and responsibility to the regions. In 1995, the state transferred one of its key powers, grain (food-security) policy, to the provinces. It has always been a key policy objective of China’s central government to maintain a nationwide balance of demand and supply of grain. One of the few economic achievements during the CCP era has been “providing food security to one-fifth of the world’s population.” However, under the new “governor’s responsibility system,” 18 provincial governments assumed the responsibility of balancing their own provincewide grain supply and demand through interprovincial grain trade. This trade established an interprovincial wholesale market to replace centrally planned interprovincial grain transfers. It also replaced the nationwide grain security policy with provincial policies. 19
Provinces have already shouldered the responsibility of all primary and secondary education and a large portion of postsecondary education. China’s latest plan for reform of the education system calls for the “sale” of a large portion of those traditionally state-financed universities and colleges to the provinces. Production of human capital in the future and the investment decisions concerning human capital will be the responsibility of the provinces. Due to the diversity in economic development among the regions, China has in effect started to and will most likely continue to rely on the provinces to institutionalize their social welfare and pension systems, which so far have yet to be established.
If such key pillars of the socialist market economy as the food-security system, the social security system, and the education system can be delegated to the provinces, there is no reason that other economic decisions cannot be decentralized. For example, recent trends have strongly suggested that China’s banking system will be reorganized to form regional (multiprovincial) central banks (similar to the Federal Reserve Banks in the United States) and regional commercial banks serving areas not bounded by administrative regions (e.g., provinces). Once the Chinese economic regions have their economic sovereignty within the framework of a national market (or even an international market), different regional socioeconomic systems will emerge. Economic regionalization may eventually lead to plural social and political subsystems in China.
Nine Emerging Regional Economies
If China’s central authority maintains the current trend of market-based institutional reform and steadily decentralizes its economic power to regional authorities, many regional economies with relatively independent industrial structures and markets will consequently emerge. Regionalization may even be accelerated if Chinese macroeconomic strategic planners take into account the natural-resource constraints on growth and accelerate economic decentralization and regionalization. Jian Wang 20 and other authors 21 suggest that there will likely be nine or ten regional economies with metropolitan centers. If this occurs, China will probably enjoy its highest growth potential, with a compound annual growth of over 7 percent up to 2020.
Table 11.3 lists the nine metropolitan economies identified by State Planning Commission studies, 22 as well as their geographic and economic data. These nine economic regions together comprise 67 percent of China’s population, 74 percent of its plains, and 71 percent of its GDP in 1996. Among them, five are coastal regions. Liaoning, the Capital, and Shandong regions are located around the Bohai Sea on China’s northern coast, whereas Greater Shanghai comprises the vast area of the Yangtze and the Qientang River Deltas, while the Pearl River Delta is located on the southern coast. There is one near-coastal region: West Jiangsu and Anhui, where 10,000-ton ships can travel via the Yangtze River. Finally, there are three inland regions: Jilin-Heilongjiang at the northeast corner neighboring with North Korea and Russia, Hunan-Hubei-Jiangxi (or the south-central region) at the center of Mainland China, and Sichuan in the midwest.
At present, these regions have built or are building relatively modern intraregional land transportation systems. In addition, they have either developed their own regional markets with relatively independent industrial structures, or they are developing their own industrial systems. Nevertheless, interregional transportation relies heavily on frequently congested railways that are inadequate for meeting the shipping needs of a nationwide industrial system for a population of 1.5 billion.
These regional economies have emerged or are emerging as a natural consequence of urbanization and marketization. Their development pattern is surprisingly similar to Japan’s regional development. Japan’s regional economies typically have an area of 200 to 300 kilometers in radius (126,000 km2 to 283,000 km2) with a population over 30 million. A network of urban centers with a relatively independent system of industries characterizes each region. The urban network consists of a group of geo-economically affiliated cities containing one or two metropolitan areas, such as manufacturing and commercial service centers complemented by a number of smaller satellite cities that may specialize in specific industries. Connected by well-developed interurban transit systems, the metropolitan centers and satellite cities with their surrounding rural areas constitute an independent production and consumption system or regional economy. Market forces impel the allocation of the regions’ resources toward constructing localized industrial structures so that maximum production efficiency and therefore the greatest economic benefits can be enjoyed. Interregional activities are engaged in only when comparative advantages exist.
| Table 11.3: Nine Emerging Metropolitan Economies in China, 1996 | |||||||||||
| Major regional Economies | Population (million) 1996 Year End | Share in Total Population % | Area (1,000 km2) | Share in Total Area % | Per Capita Plains (m2) | Plains (1,000 km2) | Share in Plains % | Major Metropolitan Areas or Cities | Regional GDP (US$billion)2 | Share in National GDP % | Per Capita GDP (US$)2 |
| Capital Region | 86.91 | 7.10% | 216 | 2.25% | 1,070 | 93.0 | 8.07% | Beijing, Tianjin, Shijiazhuang | 74.261 | 9.13% | 854 |
| Liaoning | 41.16 | 3.36% | 146 | 1.52% | 1,214 | 50.0 | 4.34% | Shenyang, Dalian | 37.999 | 4.67% | 923 |
| Jilin-Heilongjiang | 63.38 | 5.18% | 656 | 6.83% | 3,679 | 233.2 | 20.24% | Changchun, Harbin | 45.003 | 5.54% | 710 |
| Shandong | 87.38 | 7.14% | 153 | 1.60% | 1,122 | 98.0 | 8.51% | Jinan, Qindao | 71.726 | 8.82% | 821 |
| Hunan-Hubei-Jiangxi | 163.58 | 13.37% | 564 | 5.88% | 868 | 142.0 | 12.33% | Wuhan, Changsha, Nanchang | 85.856 | 10.56% | 525 |
| Sichuan | 114.30 | 9.34% | 567 | 5.91% | 123 | 14.0 | 1.22% | Chengdu, Chongqing | 50.722 | 6.24% | 444 |
| Pearl River Delta | 69.61 | 5.69% | 186 | 1.94% | 603 | 42.0 | 3.65% | Guangzhou, Shenzhen, Zhuhai | 78.449 | 9.65% | 1,127 |
| West Jiangsu and Anhui | 78.70* | 6.43%* | 191 | 1.99% | 915 | 72.0 | 6.25% | Nanjing, Yangzhou, Hefei | 54.227* | 6.67%* | 689 |
| Greater Shanghai | 83.78* | 6.79%* | 184 | 1.92% | 1132 | 109.9 | 9.54% | Shanghai, Suzhou, Hangzhou, Ningbo, Wuxi, Changzhou | 114.8* | 14.12%* | 1,370 |
| Subtotal | 816.52 | 66.72% | 2,869 | 29.8% | 932 | 854.1 | 74.14% | 579.343 | 71.26% | 710 | |
| Other Regions | 407.13 | 33.26% | 6,737 | 70.2% | 726 | 297.9 | 25.86% | 233.560 | 28.74% | 574 | |
| China | 1,223.89 | 99.98%1 | 9,600 | 100% | 941 | 1,152.0 | 11.98%3 | 812.993 | 100.0% | 664 | |
|
Sources: China National Statistics Bureau, China Statistical Yearbook, 1996 and 1997 (Beijing: Zhongguo tonji ju, 1997 and 1998); A strategic Study of China’s Regional Development, State Planning Commission, 1996. Notes: 1. Military personnel are not included. 2. 1996 mid-year US$-RMB$ exchange rate=1:8.31. 3. Plains share in total area. *Estimates based on provincial data. |
|||||||||||
Although the central government may use macroeconomic policies through a national fiscal system to transfer resources interregionally and to protect national interests, most interregional economic exchanges should rely on the market mechanism. This regional development model of the metropolitan economy is the trend most Chinese regions have followed. It is probably the least costly method for China’s future economic development.
Four Emerging World-Class Economies: The Chinese Tigers
Fujian, a southeast coastal province (located between the regions of Greater Shanghai and the Pearl River Delta, with a population of 30.2 million), has been “left out” from the SPC’s study of nine metropolitan economies in the mainland, 23 but can be easily integrated with its newly industrialized neighbor, Taiwan, across the Taiwan Strait (about 150 kilometers in average width) to become an export-oriented regional economy. Due to its physical-geographical characteristics, Fujian is relatively isolated from its neighbor provinces of Zhejiang, Jiangxi, and Guangdong by mountains and hills. But historically, Fujian has been the forerunner of international contacts via the sea since its ports were opened to international trade with Southeast Asian countries, India, and Arabian countries in the fifteenth century. The Pearl River Delta, or Guangdong, can also be easily integrated with Hong Kong and Macao to become another export-oriented economy. 24
If integrated with Fujian and Guangdong, Taiwan, Hong Kong, and Macao will benefit from higher returns on their existing capital stocks as well as from new investment opportunities. Integration will provide Taiwan and Hong Kong with scale economy, abundant supplies of primary labor, and cheaper food and materials. It will also expand markets for their manufactured goods, modern technology, and commercial services. These institutional and structural changes will essentially enable the aggregate production of these newly industrialized economies to enjoy a return to a scale greater than unity for a certain period of time. That is, with the same amount of factor inputs, they would produce more outputs if they got free access to Fujian’s and Guangdong’s vast resources and commodity and service markets. Or, in other words, the real marginal returns to Taiwan’s and Hong Kong’s labor and capital would be raised. This will eventually propel their real per capita GDP (or the average real income) to grow faster. All of these economic advantages are estimated to generate as much as 2–4 percent economic growth annually in the next two decades in addition to Taiwan and Hong Kong’s normal growth. 25
On the other hand, if economically integrated with Hong Kong and Taiwan, Guangdong and Fujian will enjoy injections of Hong Kong and Taiwan capital, technology, and commercial know-how. Since Taiwan and Hong Kong will supply the capital and technology required for Guangdong’s and Fujian’s economic development, China would then direct its scarce capital resources to the economic development of other regions. Taiwan-Fujian and Hong Kong–Guangdong will become new regional economic powers with economic scales (in terms of GDP) even greater than their neighboring regions—Greater Shanghai (Shanghai, Zhejiang, and southern Jiangsu) and south-central China (Hunan, Hubei, and Jiangxi), with significantly larger populations.
Once Fujian and Guangdong start to integrate with Taiwan and Hong Kong and become open economies, their industrial structures will also evolve toward industrial and service orientation. There will be structural changes in Fujian and Guangdong: less-productive labor will flow to higher-paid industries, and therefore further productivity gains will occur. Hong Kong and Taiwan’s quality commercial services and international connections will also lead Fujian and Guangdong into the international market. As a result, Fujian and Guangdong will not only become more productive but will also become more integrated with international markets.
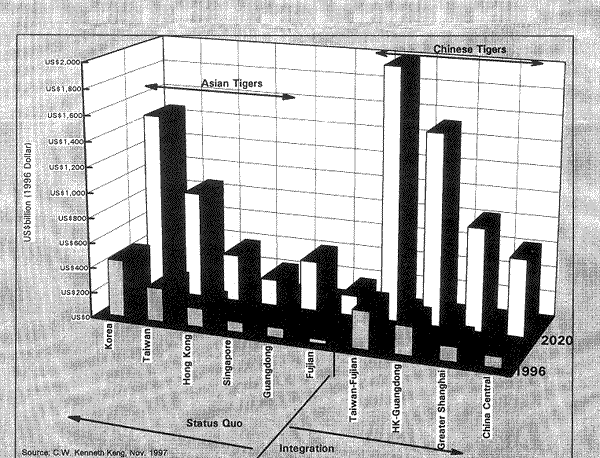
Because the required capital and technology for Guangdong’s and Fujian’s economic development will be sufficiently supplied by Taiwan and Hong Kong, China may then direct its scarce capital resources to the economic development of other regions. A quarter century from now, there will emerge at least four new world-class regional economic powers within Greater China: Taiwan-Fujian, Hong Kong–Guangdong, Greater Shanghai (Shanghai, southern Jiangsu, and Zhejiang), and the south-central region (Hunan, Hubei, and Jiangxi). These four regions will experience higher growth than the rest of the Chinese economic regions. 26 Furthermore, we anticipate that by 2020, the Taiwan-Fujian and Hong Kong–Guangdong economies will have surpassed the size of South Korea’s and will have become the new Asian Tigers in the twenty-first century (refer to Table 11.4 and Figure 11.5).
As shown in Table 11.4, in 1996 Taiwan and Fujian had a combined population of over 50 million and a total GDP of greater than one-third of China’s. Taiwan’s manufacturing capacity and technology, human and financial capitals, degree of internationalization, and commercial expertise will sustain its integration with Fujian’s less skilled labor force and natural resources. In addition, Hong Kong and Guangdong had a combined population of over 75 million and a total GDP of US$224.6 billion in 1996, which was more than a quarter of China’s GDP. Hong Kong’s 6.3 million people speak the same dialect as the people of Guangdong, and over the past two decades almost all of Hong Kong’s manufacturing plants have been moved to the Pearl River Delta area. As a result, Hong Kong, with its advanced financial systems, international commercial expertise, and modern transportation and communication facilities and technology, has become a port city servicing southern China.
Table 11.4 also shows that if fully economically integrated with Fujian and Guangdong, Taiwan and Hong Kong may grow at a rate of 8 percent and 7 percent, respectively, from the present to 2020. Otherwise, Taiwan and Hong Kong will only grow, at best, by 5 percent and 4 percent per annum, respectively.
| Table 11.4: Chinese Tigers Versus Asian Tigers: Present and Future | ||||||||
| Status Quo Scenario | ||||||||
| 1996 | 2020 | |||||||
| Economy | Population Million | GDP US$Billion (1996 Dollar) | GDP (PPP) US$Billion (1996 Dollar) | GDP Per Capita US$ (1996 Dollar) | GDP Per Capita US$ (PPP) (1996 Dollar) | Compund Annual Growth Rate | GDP US$Billion (1996 Dollar) | GDP Per Capita US$ (1996 Dollar) |
| Korea | 44.8 | 451.4 | 526.4 | 11,750 | 13,702 | 5% | 1,456 | 33,793 |
| Taiwan | 21.6 | 264.9 | 308.8 | 12,265 | 14,298 | 5% | 854 | 35,274 |
| Hong Kong | 6.3 | 146.2 | 150.5 | 23,200 | 23,882 | 4% | 375 | 58,111 |
| Singapore | 3.1 | 81.8 | 73.1 | 26,400 | 23,592 | 4% | 210 | 66,127 |
| China | 1,223.9 | 825.4 | 4,486.2 | 678 | 3,685 | 6% | 3,187 | 2,187 |
| Guangdong | 68.8 | 78.4 | 426.4 | 1,145 | 6,222 | 7% | 398 | 3,692 |
| Fujian | 32.61 | 31.4 | 170.5 | 979 | 5,321 | 7% | 159 | 3,158 |
| Macao | 0.4 | 7 | 6.7 | 17,475 | 16,726 | 4% | 18 | 43,771 |
| Economic Integration Scenario | ||||||||
| 1996 | 2020 | |||||||
| Taiwan-Fujian | 54.2 | 296.3 | 479.3 | 5,407 | 8,747 | 8.3% | 1,989 | 30,252 |
| Taiwan | 21.6 | 264.9 | 308.8 | 12,265 | 14,298 | 8.0% | 1,680 | 69,578 |
| Fujian | 32.6 | 31.4 | 170.5 | 979 | 5,321 | 10.0% | 309 | 7,745 |
| HK-Guangdong | 75.5 | 224.6 | 576.9 | 2,911 | 7,475 | 8.3% | 1,514 | 15,967 |
| Hong Kong | 6.3 | 146.2 | 150.5 | 23,200 | 23,882 | 7.0% | 742 | 93,935 |
| Guangdong | 69.61 | 78.4 | 426.4 | 1,145 | 6,222 | 10.0% | 773 | 9,056 |
| Greater Shnghai | 83.8 | 114.8 | 623.9 | 1,370 | 7,446 | 8.5% | 813 | 7,771 |
| South-Central China | 163.6 | 85.9 | 466.6 | 525 | 2,853 | 8.5% | 608 | 2,977 |
|
Sources: China NAtional Statistics Bureau, China Statistical Yearbook, 1997 (Beijing: Zhongguo Tonji ju, 1998); “A Study in Regional Development Strategies of China,” Asiaweek, Septmeber 1996. Notes: US$ and RMB$ exchange rate=1:8.31 (mid-year rate). PPP Price Factor: In 1996, US$1.00 worth of goods and services in China was assumed to be equivalent to US$5.435 (PPP). 1996-2020 Population Growth Assumptions: Taiwan: 0.5%; Hong Kong and Macao: 0.1%; China: 1.0%. |
||||||||
Figure 11.5 Asian Tigers and Chinese Tigers: 1996 Versus 2020
Benefits of Regional Integration
Taiwan and Hong Kong will attain higher productivity if integrated with Fujian and Guangdong. For example, Taiwan’s prices for industrial-use land are between two to three times Japan’s average, and Hong Kong’s land cost is even higher than Taiwan’s. If integrated with Fujian, Taiwan will probably restructure its industries so that low-productivity sectors such as agriculture and less technology-intensive manufacturing industries can be moved to Fujian, where land prices, water resources, and labor costs are much lower. Taiwan’s investment in the Fujian agricultural sector will generate a much higher return. In addition, Taiwan’s downsized agricultural sector will release valuable land as well as huge capital and labor to industrial and commercial sectors for producing outputs with much higher added values. These changes will also help Taiwan to restrengthen its environment.
Taiwan’s labor market will also be restructured. Professionals and technicians can assist in Fujian’s economic development, which will certainly reduce Fujian’s need for skilled labor and quality professionals and will lower its investment in human capital. Meanwhile, Fujian’s abundant and inexpensive labor can largely ease Taiwan’s shortage of less-skilled laborers (e.g., construction workers, assembly-line operators, steel mill workers, etc.). Taiwan’s well-educated and trained manpower can then be better utilized for higher productivity. Labor mobility between Taiwan and Fujian will not only raise the productivity of both economies, but will also lower their real unit labor costs; hence both economies will enjoy greater competitiveness in international markets. Moreover, if integrated with Fujian, Taiwan will also gain access to the mainland markets of food and raw materials. Therefore, material prices for Taiwan’s production and the cost of living for its whole population will be lowered. This will definitely improve the competitiveness of Taiwan products in international markets.
Since Fujian is a part of the mainland, enterprises in Fujian that are invested in by Taiwan will produce “domestic” products to which the vast market of China will have access. These investments will not only greatly increase the market share of Taiwanese enterprises on the mainland, but will also enable them to optimize their production scales. Hence, an expansion of production and an improved productivity would generate additional growth for Taiwan’s economy. These economic advantages are estimated to generate as much as 2–4 percent economic growth in addition to normal growth. 27 Table 11.5 provides estimates of productivity gains and additional growth that Taiwan will enjoy if it is integrated with Fujian.
| Table 11.5: Taiwan’s Additional Growth Resulting from Integration | ||
| Productivity Gain | Additional Growth | |
| Sectoral Shift of Labor | 0.5%-1.5% | 0.5%-1.5% |
| Larger Market & Scale Economy | 0.5%-1.0% | 0.5%-1.5% |
| Deletion of Tariffs & Other Trade Barriers | 0.5%-1.0% | 0.5%-1.0% |
| Lower costs of factor inputs and materials | 0.5%-1.0% | 0.5%-1.0% |
| Production Division | 1.0%-2.0% | 0.5%-1.0% |
| Total | 2.5%-6.0% | |
Economic Integration: A Win-Win Strategy
Having been arch enemies for almost forty years (1949–1987) and then having experienced ten years of cultural and commercial exchanges, Taiwan and Mainland China have reached a stage where they may reopen the semiofficial talks that were suspended unilaterally by the mainland following President Tenghui Lee’s visit to the United States in the summer of 1995. For the foreseeable future, a political resolution of the “One China” issue is unlikely. Meanwhile, many strategists suggest this issue may simply be tabled or downplayed so that other mutually beneficial issues can be dealt with. At present, a politically unified China remains a distant goal rather than a realistic objective. Yet, Taiwan’s and Hong Kong’s economic integration with China plays a crucial role in accelerating China’s economic growth. In effect, it will propel China’s future growth toward its highest potential. The speed and the scale of Taiwan’s and Hong Kong’s economic integration with China will decisively affect China’s economic growth course in the next two decades. On the other hand, Taiwan and Hong Kong may also benefit from a fast-growing Chinese economy.
Hong Kong’s reversion to China, recent developments across the Taiwan Strait, the increasing capabilities resulting from the Asia Pacific Economic Cooperation (APEC), China’s and Taiwan’s progress toward joining the World Trade Organization, and President Clinton’s visit to China have all created a spirit of optimism concerning affairs cross the Taiwan Strait. As discussed in the last section, there are clear advantages to economically integrating Taiwan and Hong Kong with the neighboring Chinese regions of Fujian and Guangdong. These two integrated economies (Taiwan-Fujian and Hong Kong–Guangdong) may not only become two new “Asian Tigers” in the new century, but will also propel other Chinese regional economies to robust and sustainable growth.
However, from nearly a century ago to the present, the economies of Taiwan, Hong Kong, and Macao have been politically and socially different from that of China. While the benefit of this integration can clearly and easily be seen, it may not be easily conducted when the huge differences in various dimensions between the involved economies are taken into account. These difficulties will make this integration a long process of market integration and industrial restructuring that will require extensive cooperation and coordination in almost all aspects of the socioeconomic systems. It indeed presents a real challenge to the political wisdom of the people on both sides of the Taiwan Strait. Furthermore, this integration is not merely a “domestic” affair; it also has international dimensions: it will affect all those nations having investment and trade relations with the involved economies. It is hence crucial to search for a practical approach that may be accepted by people on both sides of the Taiwan Strait.
Economic Integration Models
Many social and economic systems have been developed to provide frameworks to coordinate the economic affairs of member nations without affecting the fundamental rules governing their political relationships. Economic integration of states or regions can take a variety of forms, ranging from open economy, free trade area, custom union, common market, and economic union, to complete integration. Although these models of economic integration may not readily apply to the Taiwan-China case, they nevertheless can be considered as possible starting points. Instead of analyzing hypothetical models, we proceed with an examination of the following realized integration models:
The commonwealth model. The member economies of a commonwealth recognize a common goal but have no formal political accords or detailed agreements on economic affairs. Each member may still exercise its own political sovereignty and economic powers. The model is essentially feasible for cultural exchanges between Taiwan and Mainland China. It is indeed in accord with the short-term phase of exchanges and reciprocity under the Republic of China’s Guidelines for National Unification. It is also consistent with China’s long-announced policy of increased people-to-people exchanges with Taiwan. Under this framework, Taiwan and Mainland China may progress to some solid cooperation toward cultural integration. For example, Taiwan may participate in China’s efforts toward hosting the 2008 Olympic Games in exchange for hosting a part of the games in Taiwan. China may also support Taiwan’s effort toward hosting future Asian Games. Taiwan and China may also form joint committees to work on all kinds of cultural integration issues such as the unification of computer codes for Chinese systems, interconnection of on-line library systems, publication of textbooks and ancient Chinese books, joint investigations into traditional Chinese medicine and into historical concerns, the promotion of traditional Chinese philosophy, value systems, and language, and much more.
The NAFTA (North American Free Trade Agreement) Model. Each member signs an agreement that states that within a certain time frame, every member economy will amend its domestic laws and regulations so that free trade and fair competition within the joint territory of all members will be attained. While each member retains its own sovereignty, all free trade–related disputes (such as dumping, counterfeiting, intellectual property rights, compatibility of social welfare systems, and environmental standards) are resolved by joint governmental or public agencies. This model is readily applicable to provide security and fairness for cross–Taiwan Strait trade and investment that have been desperately awaited by Taiwan businesspeople and investors. It is worth stressing that a free-trade agreement is not merely a commercial trade agreement. It can essentially be viewed as a potential systematic approach to the realignment of all economic, social, and legal standards in Taiwan and China so that the free movement of goods, services, capital, and personnel is achieved. Such an agreement actually involves a lengthy process during which both sides can gradually adapt to a full cooperation that facilitates free trade.
We acknowledge that the free-trade negotiation may essentially constitute a milestone or serve as an unavoidable step toward unification. Only economic cooperation works; therefore, we hope that regions on both sides of the Taiwan Strait will proceed further toward cooperation and coordination in government regulations and policies, which are necessary steps in achieving social and political unification. The negotiation of a free-trade agreement between Taiwan and China is essentially a logical and pragmatic process that can lead toward greater integration.
The European Union Model. While each member may still execute its own discretionary policies in domestic and foreign affairs, the European Union (EU) model provides a united front on almost all external economic issues. Free trade, common external tariffs, and free mobility of production factors are gradually attained, along with an integrated economy that has a centralized monetary authority issuing a single currency. Military cooperation and strategic/security partnerships (e.g., NATO) are also strengthened but not included in the EU framework. Each member nation may still exercise its own political powers and assert its own international sovereignty. However, each member also has to cooperate with other member nations (or even be coordinated by the European Council and Commission) for those policies with overlapping common interests of other member countries (e.g., monetary and taxation policies). The EU model essentially provides a policy coordination system that is governed by the European Council that represents governments of member countries, and is administered by an executive body, the European Commission, that is independent of the governments of member countries. The EU model presents a big leap forward from the NAFTA model because it necessitates joint governmental maneuvers in policy coordination, which clearly articulate a certain form of political integration.
The Chinese Model
While none of these models may apply directly to the Taiwan-China case, the commonwealth model of cultural exchanges and the NAFTA model of interregional free trade provide common ground that may, to a certain extent, be acceptable to regions on both sides of the Taiwan Strait as intermediate phases toward ultimate unification. By the end of the twentieth century, the world will have witnessed the German reunification and also the dissolution of the Soviet Union. German reunification essentially provides a model of political resolution for a bisected nation. Yet, given the incomparable sizes of Taiwan, Hong Kong, and Mainland China, and with the huge structural differentials in their current political systems, the German reunification model could hardly be applied. Taiwan, Hong Kong, and Macao may, with reason, be concerned about being “devoured” by the vast Chinese mainland if an immediate political reunion were actualized. To ease this legitimate concern, we suggest that an adaptive process toward ultimate unification be established.
The process can be adaptive in the sense that all parties can, in a step-by-step manner and at their own discretion, negotiate a common agreement with the others. The adaptive nature of this process may enable the gradual establishment of a socioeconomic framework within which all their economic affairs may be eventually coordinated. Once such a framework has been established, people on both sides of the Taiwan Strait may then be ready to proceed toward political integration. Or, by that stage, the economies on both sides of the Taiwan Strait may readjust their priorities according to the interests of the majority of their peoples. Another striking feature of this adaptive process is that it does not necessarily need to follow any predetermined timetable. Different rounds of discussion can adapt or proceed according to agreements reached in previous rounds of negotiations. This adaptive process would in essence follow the mainland’s philosophy used throughout its reform era: “groping for stones on which to cross the river.”
Our suggested process is divided into three phases: the phase of cultural and nongovernmental exchange, the phase of free trade and common external tariffs, and the phase of monetary and economic union. We estimate that this process of economic integration may take as long as two to three decades to accomplish.
Phase I: The Chinese Commonwealth. Before a free trade agreement is negotiated, Taiwan, Hong Kong, Macao, Mainland China, and even Tibet and Mongolia may form a nongovernmental and nonpolitical commonalty of cultural cooperation and coordination: the Chinese Commonwealth. Within this Chinese Commonwealth, every member maintains its economic, political, and social status quo but may engage in cooperation and coordination in all aspects of cultural and nongovernmental affairs. This cultural cooperation and coordination may include joint efforts toward hosting the Olympic Games and other international cultural/sports events, joint memberships in international nongovernmental organizations and in academic and professional associations, coordination in unifying computer technology for Chinese applications, cooperation in humanity and science researches, and/or joint development of Chinese library and other information systems. During the commonwealth phase, members may also engage in free-trade agreement negotiations.
Phase II: The Chinese Free-Trade Area. Once the free-trade agreement is reached among Mainland China, Taiwan, Hong Kong, Macao, and others, the parties may attain greater cooperation and coordination in economic affairs and may then proceed to engage in forming a common economic front that would maximize their economic benefits internationally. Coordination in economic affairs may include not only free movement of goods and services within the free-trade area, but may also include freer movement of factor products such as capital, labor, information, and technology. The member economies may also start negotiations that would establish a common external tariff before proceeding toward a common market. During this phase, member economies may gradually readjust their industrial structures, production divisions, and market concentrations to achieve a better overall economic blend. Their industrial and engineering standards, health and environmental protection codes, transportation and communication regulations, social security requirements, business legal systems, and so on, may also be gradually aligned to facilitate a free flow of economic activities within the free-trade area.
During this phase, it is clear that direct communication and commercial relations across the Taiwan Strait will be established, which will accommodate China’s immediate objectives. It is also clear that during this phase, mutual trust and cooperation between Taiwan and China will also be developed. This is consistent with the objective of the intermediate phase specified in the Republic of China’s Guidelines for National Unification.
Phase III: The Chinese Union. When free movements of goods and services and a common external tariff within the free-trade area have been attained, the member economies will be ready for a more extended economic integration: financial and monetary coordination, free interregional mobility of production factors, and governmental coordination of an elected economic policies council for governing interregional affairs, and so on. These characteristics of economic integration will enable member economies to move toward a much greater breadth of coordination among governments not only in economic affairs but also in legal and political aspects. The European Union’s formative experiences may provide tremendous assistance to the formation of the Chinese Union. 28
A Time Frame for Integration
Once Chinese economies reach complete economic integration, they are ready to decide whether or not a political union in the form of a confederation, a federation, or a unity state should be constituted. However, given the fact that after signing the NAFTA treaty it may take up to fifteen years for the United States, Canada, and Mexico to complete their free-trade commitments, and also considering that it took more than four decades for European countries to negotiate and ratify the European Union accord, Chinese economic integration may take at least the same length of time in view of the differences in social systems and economic policies and the need to turn political antagonism into harmony.
If China tries to industrialize its economy by 2010, as its first fifteen-year long-term plan calls for, its first priority then should be to develop a stable economy as fast as possible by incorporating all potential resources. Taiwan’s capital and technological and international commercial know-how will be valuable resources, for it is clear that China needs not only capital but also technological and commercial know-how. On the other hand, if Taiwan’s priority is to provide a stable and secure business environment for its advancement toward a technologically oriented economy, it must resolve any security issues stemming from the unstable China-Taiwan relations. Neither can Taiwan afford to lose the vast market of China. It is also clear that Taiwan needs not only China’s markets, but also China’s less-skilled labor (Taiwan has already imported a great number of primary laborers from Southeast Asian countries). Taiwan and China may therefore be economic complements to each other. The NAFTA model provides a perfect starting point for regions on both sides of the Taiwan Strait to negotiate for better flows of capital, goods, and services.
If it takes the regions on both sides of the Taiwan Strait the next five years to negotiate a free-trade agreement similar in extent to the NAFTA, that will allow signed partners ten to fifteen years to reduce their customs duties to zero. It will take as long as twenty years for Taiwan and China to complete their free-trade agreement. Our expectation is that in the foreseeable future, or by 2020, Chinese economies may, at the fastest, have been ready to engage in negotiations toward forming the Chinese Union. By 2020, most of the prewar-born Chinese will have retired, and the regimes of the regions on both sides of the Taiwan Strait will be in the hands of those born long after the Chinese civil war. The political environment may then be largely different from what it is perceived to be at present. And by then, the Chinese economies of Taiwan, Hong Kong, Macao, and the mainland may have reduced the differences in their economic and social systems. When diversities between the regions on both sides of the Taiwan Strait diminish, Chinese reunification will no more be a problem, or, perhaps, it will no longer be an issue at all.
Conclusion
Sustainable economic growth is necessary for China’s future stability. Clearly, sustainable growth depends on continued commitments to institutional reform and economic deregulation. China’s relaxation of government intervention in economic activities has led to decentralization of the central governmental authority over economic planning and control. This decentralization will consequently lead to the emergence of regional economies in Mainland China. In the next two decades, there will likely be ten regional economies with relatively independent industrial structures emerging in Greater China as a result of economic decentralization.
There are three prospects for China’s economic growth: (1) low-growth scenario postulated on a reversion to an authoritarian socialist government, (2) stable-growth potential based on an extrapolation of China’s current policies and trends, and (3) high-growth potential based on the policy regime of economic deregulation and decentralization. Under the stable-growth scenario, China will progress along lines of gradualism by “groping for stones on which to cross the river.” This will enable the Chinese economy to grow at a compound annual rate of 5.8 percent between 1997 and 2020. In contrast, under the socialist hard-liner postulation, the economy will grow more slowly at an annual rate of 4.3 percent in the same period. If China speeds up its efforts toward economic deregulation and decentralization, it will achieve its high-growth potential at an annual rate of 7.4 percent up to 2020. Should this take place by 2020, mainlanders will enjoy a living standard as high as that enjoyed by Taiwan residents at present.
Given the fact that a politically unified China remains a distant goal, the strategy of an economic union of Greater China is probably an optimal and realistic approach for all parties across the Taiwan Strait to work toward. The theoretical Chinese Economic Union, as a multiregional conglomerate with different institutional arrangements of economic, social, and political systems, may result in a dynamic process that works toward the goal of unification. The strategy will essentially combine Taiwan and Hong Kong economic forces to impel China’s economic growth to its highest potential. It will in turn benefit Taiwan and Hong Kong. This strategy has a win-win prospect in the sense that no party will sacrifice its political objective for economic integration, while all parties will benefit from it. Free mobility of Taiwan’s and Hong Kong’s financial and human capitals as well as goods and services within the integrated southeastern coast of Greater China will propel these economies to another plateau of economic growth. A rapidly growing southeastern Greater China will not only provide new investment, commercial expertise, and industrial technology to the Chinese inland regions, but will also generate huge market demand for the materials, goods, and services of inland regions. China’s economic growth will hence be durable and sustainable.
Appendix
Physical Limitation on China’s Growth:
The Shortage of Plains
China consists of 9.6 million square kilometers (km2) of which less than 12 percent (1.15 million km2) are plains. According to a recent survey, China has about 1,988 million mu 29 (1.32 million km2) of cultivated land, 30 which account for about 13.8 percent of its total area. Of the cultivated land, 1,290 million mu (859,269 km2) are on plains (with a gradient not exceeding 8 degrees), which account for 75 percent of China’s plains area. This leaves merely 25 percent of the plains (290,000 km2) for urban, industrial, and land transportation development, infrastructure construction, and other nonagricultural uses.
The per capita area of plains for nonagricultural use in 1996 was 238 square meters (m2). In the coming quarter century, China’s population will grow to 1.5 billion. This per capita statistic will then “shrink” to 194 m2 if China maintains its agricultural use of plains to the extent it does today. On the other hand, if in the next quarter century China keeps its present standard of per capita nonagricultural use of plains, its agricultural use of plains will have to be reduced to accommodate the growing urban population and industrial and commercial developments. In this case, by 2020 China will have to have released an area as large as 40 percent of the current area of agricultural plains for nonagricultural uses. This will create problems such as an inadequacy of the domestic food supply, insufficiency of domestic production of food, impaired environment, and so on. These problems are considered as priority national security issues in China. There is little chance that the Chinese authorities would lower the announced food sufficiency level below 90 percent (the current level is 95 percent). Therefore, there is a severe limitation to releasing China’s agricultural land for other uses.
| Table 11.6: China’s Limitation of Plain Lands for Economic for Economic Development | |||||
| Year | Population (Million) | Plain Area (1000 km2) | Per Capita Plain Area (m2) | Plains Per Capita for Nonagricultural Use (m2) | Plains for Nonagricultural Use (1000 km2) |
| 1996 | 1,223.89 | 1,152 | 941 | 238 | 290,811 |
| 2020 | 1,502 | 1,152 | 766 | 194* | 356,893+ |
|
Notes: *Based on the 1996 plains area for nonagricultural uses. + Based on the 1996 per capita plain area for nonagricultural uses. |
|||||
Use of Plains for Transportation
In 1992, Japan had a per capita plains area of 792 m2 and the United States enjoyed over 25,000 m2 of plains per capita. China’s per capita plains area in 1997 was 941 m2, and it is expected to decline to 767 m2 by 2020 when the population grows to 1.5 billion. If the span (extensiveness) of land is taken into account, China’s land transportation use of plains areas should be much larger than Japan’s. This is because China’s area is 25.3 times Japan’s, and only one-third of China’s provinces are coastal. Therefore, China needs much more long-distance land transportation than Japan does. Land transportation, due to construction technology and costs, should mostly take place on plains. High demand for long-distance land transportation means more highways and railroads should be built.
In 1997, China had 133,339 kilometers of railways and 1,185,789 kilometers of highways. If, on average, each kilometer of railroad occupies 0.004 km2 of land and each kilometer of highway occupies 0.005 km2 of land, 31 the land required for transportation totals an area of 56,299 km2. China’s per capita transportation land in 1997 can thus be estimated at 46.1 square meters. This is about half as much as Japan’s 90 m2 in 1992. Furthermore, if 80 percent of this land transportation system had been constucted on the plains, 45,039 km2 of China’s plains in 1997 would have been used, which would have been over 3.8 percent of its total area of plains.
| Table 11.7: Estimate of China’s Land Transportation Use of Plains | |||||
| Year or Country | Land use for Land Transportation (Per Capita) | Area Used for Land Transportation (National Total) | Plains Used for Land Transportation (National Total) | Share of Total Plains | Additional Area of Plains Needed |
| 1996 | 46 m2 | 56,299 km2 | 45,039 km2 | 3.9% | |
| 2020 | 46 m2 | 69,000 km2 | 55,200 km2 | 4.8% | 10,161 km2 |
| 2020* | 135 m2 | 202,500 km2 | 162,500 km2 | 14.1% | 117,461 km2 |
| Japan | 90 m2 | 135,000 km2 | 108,000 km2 | 9.4% | 62,961 km2 |
| USA | 496 m2 | 744,000 km2 | 535,200 km2 | 51.7% | 490,161 km2 |
|
Note: *Based on 1.5 times Japan's figure. Source: U.S. and Japanese figures are from J. Wang, “Regional Development issues in China’s Ninth Five-year Plan,” in The Role of foereign Capital in china’s Industrial and Regional Development. Beijing: China Macroeconomics Society, State Planning Commision, 1997. |
|||||
Between 1996 and 2020, China will probably have to accommodate an additional 276 million in population. If it is assumed that the per capita transportation use of plains will not increase in the next quarter century, China still will need more than an additional 10,000 km2 of plains to build new land transportation to accommodate the economic activities generated by the additional 276 million people. By 2020, the total area of plains used for land transportation would be over 55,000 km2, which is 4.8 percent of the national total. This estimate may serve as the lower limit of what will be needed for land transportation by 2020 because it is based on China’s actual present experience. A quarter century from now, China’s economy may expand to at least over three times the size it is today with an additional population of over 276 million. The much larger economy will certainly generate much more demand for land transportation. As a result, per capita transportation use of land will increase significantly.
Alternative estimates based on different assumptions of per capita use of land for land transportation reveal the following data. It would take 9.4 percent of the plains areas if China constructed a land transportation system by 2020 similar to Japan’s today. As an island nation, Japan has an area of merely 4 percent that of China. And unlike China, Japan imports most of its required energy, natural resources, and materials to its major industrial regions located along its coast. This means that Japan’s demand for long-distance land transportation is relatively low. In contrast, 90 percent of China’s required energy and natural resources and 95 percent of its required grains are domestically produced. Even in the future, when China fully participates in the international division of production, it will still have to produce the vast majority of goods and services by itself.
Given China’s geographically unbalanced distribution of natural and energy resources, the future demand for land transportation to support its growing economic activities should be significantly greater than that of Japan at present. Jian Wang has argued that 1.5 times Japan’s present per capita transportation use of land, that is, 135 m2, will be needed as the basis to estimate that of China in 2020. 32 This means that 155,250 km2 of land will be needed for China’s future land transportation, which accounts for about 1.6 percent of the national area and 13.5 percent of the national plains. There is also an alternative estimate based on the present experience of the United States. More than a half of China’s plains would be required to build a system of highways and railroads similar to that of the United States. Even based on a half of the U.S. standard at present, more than 25 percent of China’s plains would be required.
Use of Plains for Urbanization
If China’s urbanization reaches 60 percent by 2020, there will be 900 million people living in urban areas. The total land required will exceed 40,000 km2, given Tokyo’s 50 m2 per capita urban use of land in 1994 as the benchmark. The total land needed for China’s urbanization will take up about 3.5 percent of China’s plains area. If 70 percent of the rural population’s houses were also on the plains, rural housing would require 17,190 km2 of plains. China’s total urbanization and rural housing needs for plains would then be estimated at 45,840 km2, which would account for about 0.5 percent of China’s total area and 4.0 percent of the total area of plains. This estimate is conservative because it is based on statistics from the most-densely populated metropolitan center, Tokyo, with extremely high prices for land.
An alternative estimate is based on Japan’s per capita urban use of land. If all cities are taken into account, Japan’s per capita urban use of land was 115 m2 in 1992. If we use this as the standard, by 2020 China will need 172,500 km2 of land for urban development; that is, China will need 1.8 percent of its total land area and 15.0 percent of its total plains area. If 90 percent of urban cities are on the plains, the actual use of plains for urbanization by 2020 will be 155,250 km2, accounting for about 1.6 percent of China’s total area and 13.5 percent of its plains.
Other cities have offered potential comparisons in the urban use of land. At present, Shenzhen is the only large city in China that was constructed according to modern urban planning. However, Shenzhen has so far accommodated mainly light industries and is still far from being fully commercialized. Therefore, its per capita urban use of land tends to fall short of that of a metropolitan area of the future. As a result, Shenzhen is not a representative city to be used as the benchmark for future metropolitan areas. Neither can Beijing and Shanghai, where most of the streets, houses, and business areas were built more than fifty years ago, be used as representative cities. There are very few areas in these cities that have been rebuilt under modern urban planning. Hence, their statistics even more seriously underestimate the future land requirement for an average metropolitan center.
The State Planning Commission estimates that by 2010 China’s urbanization will reach 60 percent and will occupy 1 percent of its total area, and that transportation will occupy 1.3 percent of its area if China adopts Japan’s “metropolitan model” to develop its economy. That is, China would not and could not plan for a nationwide division of production because a nationwide industrial structure like that of the United States requires extensive use of land transportation in order to move materials and goods. China does not have enough plains to build a minimum capacity of modern land transportation to accommodate a nationwide industrial structure for a population of 1.5 billion. Even if China adopts merely half of the U.S. standard on a per capita basis to build its land transportation system, such a system would still take up more than 25 percent of its plains. As a result, there will be conflicting demands for plains for environmental protection, food production, transportation, and urbanization. The problem will be compounded by China’s low per capita reserve of petroleum, the principal fuel for both highway and railroad transportation in the foreseeable future.
The low per capita endowment of plains areas should compel China to diversify its national economy into regional ones. Each will have its own relatively independent industrial structure and market system, so that the need for cross-regional, long-distance land transportation will decrease and the use of plains for transit systems will also be reduced. In this way, the transportation costs that constitute a portion of the transaction costs of almost all economic activities can be minimized. The economy as a whole will therefore use fewer resources for transportation to produce the same level of outputs, and macroeconomic productivity gains will be enjoyed.
This use of resources essentially provides an economic rationale to decentralize resource allocation power to regions. Possible productivity gains from this strategy have been estimated to be as high as 1.5 percent a year through 2020. Had there been no central planning and had China relied completely on market forces to allocate its resources, regionalization would already have been the natural outcome.
| Table 11.8: Estimates of China’s Urban Use of Plains by 2020 | |||||||
| Alternative Models | Urban Use of Land* (Per Capita) | Urban Use of Land (National Total) | Urban Use of Plains (90% of the total urban use of land) | Urban share of Plains | Rural Housing Use of Plains | Rural Share of Plains | Total Share of Plains |
| Japan Average | 115 m2 | 172,500 km2 | 155,250 km2 | 13.5% | 34,500 km2 | 3.0% | 16.5% |
| Tokyo | 50 m2 | 45,000 km2 | 40,500 km2 | 3.5% | 10,500 km2 | 1.3% | 4.8% |
| Shenzhen | 30 m2 | 27,000 km2 | 24,300 km2 | 2.1% | 9,000 km2 | 0.8% | 2.9% |
| Beijing | 20 m2 | 18,000 km2 | 16,200 km2 | 1.4% | 6,000 km2 | 0.5% | 1.9% |
| Source: *Figures in this column are cited from J. Wang, “China’s Macroeconomic Strategy of Regional Economic Development,” in The Role of Foreign Capital in China’s Industrial and Regional Development. Beijing: China Macroeconimics Society, State Planning Commission, 1997. | |||||||
Endnotes
Note 1: The author has benefited from discussions with and comments from the editors of this book and from Chu-yuan Cheng, Cheng Hsiao, Ronald Mitchell, and Hung-Tao Tai on an earlier version of this chapter. Financial and administrative support from the China Development Fund, the Rotman School of Management at the University of Toronto, and the faculty of Business at the University of Victoria as well as research assistance from Everett Barclay, Iris Chen, and Robin Potter are gratefully acknowledged. Back.
Note 2: By Greater China, we unambiguously mean the neighboring economic areas of Hong Kong, Macao, Taiwan, and Mainland China. Back.
Note 3: Unless otherwise indicated, the World Bank reference cited in this section is from the World Bank, China 2020: Development Challenges in the New Century (Washington, DC: World Bank, 1997). Back.
Note 4: Unless otherwise indicated, statistics cited in this chapter are based on China’s latest official statistics. The author acknowledges the potential existence of data deficiencies in official Chinese statistics and has made every effort to compare them with alternative statistics when necessary. Back.
Note 5: Eduardo Borenztein and Jonathan Ostry, “Accounting for China’s Growth Performance,” American Economic Review Papers and Proceedings 86, no. 2 (1996): 224–228. Back.
Note 6: World Bank, China 2020. Back.
Note 7: According to Asiaweek’s September 27, 1996, issue, the 1996 GDP per capita calculated at PPP of the following countries was, in U.S. currency: United States: $26,825; Japan: $22,220; South Korea: $11,750; Taiwan: $14,295; Hong Kong: $23,892; Macao: $16,840; Singapore: $23,565; Malaysia: $9,470; Russia: $5,260; Thailand: $7,535; Mexico: $7,188; India: $1,385; and China: $2,935. Because China Statistical Yearbook 1997 shows that China had a GDP per capita of renminbi (RMB) $5,634 in 1996 and the official RMB$ and US$ exchange rate in July 1996 was 8.31, this equates China’s GDP per capita in 1996 to US$678, which is much higher than the GNP per capita of US$540 used in Asiaweek. (This may be due to differences in the base year and in exchange rates adopted.) Accordingly, we adjust China’s 1996 GDP per capita at PPP to US$3,685. In this study, we use 5.435 as the 1996 PPP factor to adjust China’s price level to the international one. Back.
Note 8: Justin J. Lin, “Rural Reforms and Agricultural Growth in China,” American Economic Review 82 (January 1992): 34–51. Back.
Note 9: For further analysis of this dramatic shift in household savings, interested readers are referred to C. W. Kenneth Keng, “China’s Economic Prospects in the New Century,” Working Paper, Rotman School of Management, University of Toronto. Back.
Note 10: The World Bank’s predictions for China’s long-term average annual GDP growth rates are: 8.4 percent for 1996–2000, 6.9 percent for 2001–2010, and 5.5 percent for 2011–2020. These average to 6.6 per annum for 1996 to 2020. See World Bank, China 2020. Back.
Note 12: World Bank, World Development Report 1992: Development and the Environment (New York: Oxford University Press, 1992). Back.
Note 13: The World Bank’s most recent studies convincingly document evidence that China’s shortage of agricultural and energy resources will not significantly affect international energy and food prices in the foreseeable future. See World Bank, At China’s Table: Food Security Options (Washington, DC: World Bank, 1997), and Clear Water, Blue Skies: China New Environment in the New Century (Washington, DC: World Bank, 1997). Back.
Note 14: Wang Jian, “Zhongguo quyu jingji fazhan de zongti silu” [“China’s macroeconomic strategy of regional economic development”], in Zhongguo de chanye diqu fazhan yu waici de zuoyong [The role of foreign capital in China’s industrial and regional development], (Beijing: Guojia jiwei Zhongguo hongguan jingji xuehui, 1997), pp. 1–19. Back.
Note 15: See, for example, Guojia jiwei [State Planning Commission], Zhongguo de jingji fazhan zhanlue yu guoji xieli [China’s economic development strategy and international cooperation] (Beijing: Guojia jiwei Zhongguo hongguan jingji xuehui, 1997). Back.
Note 16: The World Bank, At China’s Table: Food Security Options. Back.
Note 17: Wang Jian, “Guanyu woguo gediqu jiuwu jihuazhong de ruogan wenti” [“Regional development issues in China’s ninth five-year plan”], in Zhongguo de chanye diqu fazhan, pp. 20–24. Back.
Note 18: The governor’s responsibility system is less popular than its nickname: “The Rice Barrel Project.” Under it, every provincial governor is personally responsible for the balance of demand and supply of grain (or rice) at the wholesale level in his own province, and each city or county mayor is personally responsible for the supply and demand of secondary foods (vegetables, meats, oil, eggs, sugar, etc.) in the retail markets within his or her jurisdictional territory. This “mayor responsibility system” also has the popular nickname of “The Vegetable Basket Project.” Back.
Note 19: Under the decentralized grain security system, provinces are free to trade grains and to subsidize farmers’ inputs and consumers’ purchases. But provinces must meet the provincial stock responsibility; that is, surplus-producing provinces must maintain a three-month supply of grain stocks, while deficit provinces must maintain a six-month supply. The state retains the power to collect the grain quota, and provincial quotas of grain at lower-than-market price must be delivered to grain bureaus at designated locations. The state also continues to maintain the national stock and the international grain trade monopoly. Private traders and provincial grain enterprises are not allowed to procure grain in the countryside until state grain quotas have been filled. This decentralization of grain security policy by itself did not have a direct impetus on grain production. However, its consequence, the deregulation of grain prices, has stimulated grain production. In 1997, the government procured grain quotas at “government unified” market prices and discontinued consumption subsidies through the grain enterprises. Back.
Note 20: Ping Wang and Yuan-li Wu, “Learning From the EC: The Implications of European Economic Integration for China and Taiwan,” American Journal of Chinese Studies (1996): 205–224. Back.
Note 21: C. W. Kenneth Keng, China’s Regional Economic Development: Status, Strategy and Prospects, Research Monograph, Rotman School of Management at University of Toronto, 1997; C. W. Kenneth Keng, “An Economic China: A Win-Win Strategy for Both Sides of the Taiwan Strait,” American Journal of Chinese Studies 2 (October 1998): 182–215. Back.
Note 22: Guojia jiwei jingji yanjiusuo ketizu (State Planning Commission Economic Research Institute Topic Group), “Zhongguo quyu jingji fazhan zhanlue yanjiu (zhubaogao) [“Studies in China’s regional economic development strategies (main report)”], unpublished mimeograph, April 1996. Back.
Note 23: Fujian has traditionally been ad hoc excluded from most of China’s regional studies mainly due to military and political sensitivities. Back.
Note 24: C. W. Kenneth Keng, China’s Regional Economic Development (Toronto: Research Monograph Series, Rotman School of Management at University of Toronto, 1997). Back.
Note 27: We acknowledge that more detailed quantitative studies are needed to qualify this claim. Figures listed in Table 11.4 are estimated by analogy using NAFTA, WTO, and EU experiences. See, for example, references included in notes 20 and 21 above, as well as Z. Wang and F. C. Tuan, “The Impact of China’s and Taiwan’s WTO Membership in World Trade—A Computable General Equilibrium Analysis,” American Journal of Chinese Studies III, no. 2 (1996): 177–204. Back.
Note 28: Interested readers are referred to the following publications for details: Council of the European Union, Treaty on European Union (Luxemburg: Office for Official Publications of the European Communities, 1992); T. Hitiris, European Community Economics. 3rd edition (Hertfordshire, England: Harvester Wheatsheaf, 1994). Back.
Note 29: Mu is a traditional Chinese measuring unit for land area. One mu = 666.1 square meters = 7,200 square feet = 0.164 acre. Back.
Note 30: China’s cultivated land area, based on its official statistical survey, was 949,700 km2 in 1996. This is significantly smaller by as much as 28 percent than the area calculated from China’s new satellite survey of 1.32 million km2. In China Statistical Yearbook 1997, it is noted that the statistical survey may underestimate the actual area of cultivated land. In our study, we adopt the satellite survey data because we believe that statistical survey data tend to underestimate the actual area, evidently because China’s agricultural taxes are essentially based on its official (statistical) survey of cultivated land. Farmers and local governments have all kinds of reasons to report lower cultivated areas of their land. Back.
Note 31: Here, we assume that railroads take, on average, a 40-meter-wide strip of land, and highways take a 50-meter-wide strip of land. This assumption is based essentially on “Chinese characteristics.” For example, in the United States, the width of a strip of land occupied by a modern highway is at least twice as much as what is assumed here. Back.
Note 32: Wang Jian, “Jiuwu he dao 2010 nian Zhongguo jingji fazhan zhanlue de zhongdian mianlin de zhuyao wenti” [“China’s economic development problems in the ninth five-year plan and in the long-term plan to 2010”], in Guojia jiwei, Zhongguo de jingji fazhan zhanlue, pp. 1–11. Back.