|
|
|
|
Report on Allied Contributions to the Common Defense
A Report to the United States Congress by the Secretary of Defense
U.S. Department of Defense
March 1998
List of Charts
| Chart I–1 | Countries Achieving Congressional Targets |
| Chart I–2 | Countries Making Substantial Contributions—Based on Ability to Contribute |
| Chart I–2 (Cont'd) | Countries Making Substantial Contributions—Based on Ability to Contribute |
| Chart III–1 | Defense Spending as a Percentage of GDP vs Per Capita GDP—1997 |
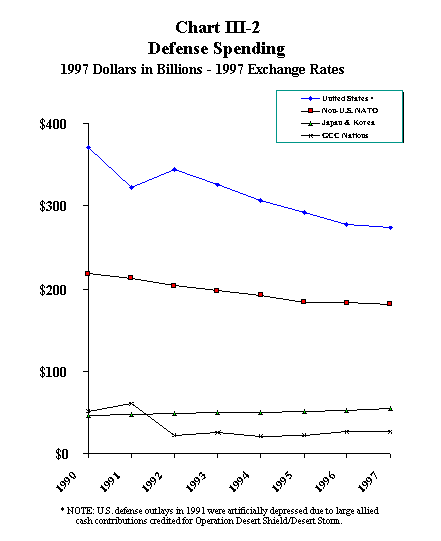
| Chart III–2 | Defense Spending—1997 Dollars in Billions—1997 Exchange Rates |
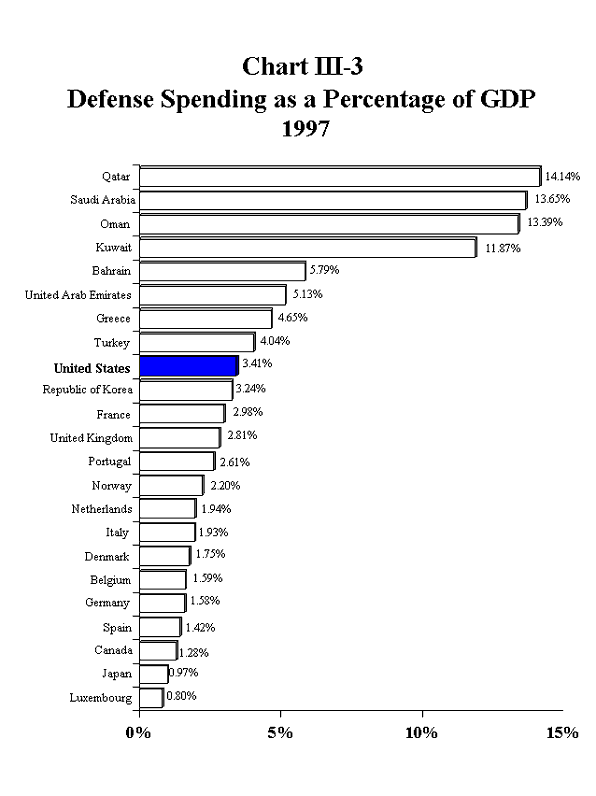
| Chart III–3 | Defense Spending as a Percentage of GDP—1997 |
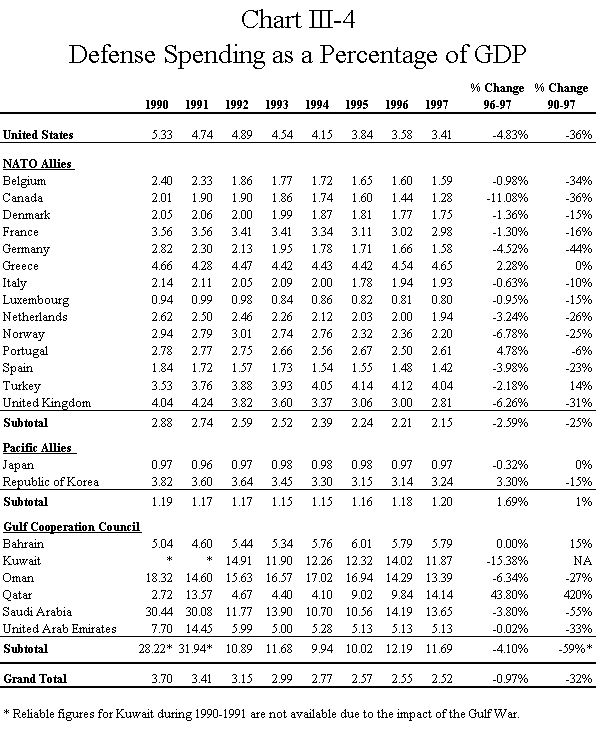
| Chart III–4 | Defense Spending as a Percentage of GDP |
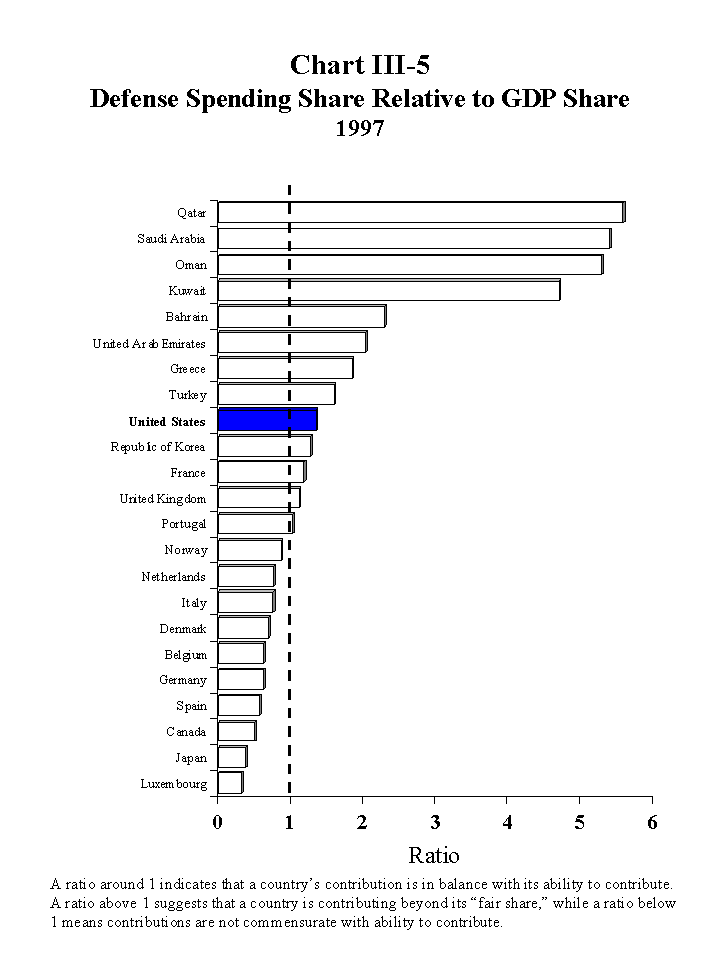
| Chart III–5 | Defense Spending Share Relative to GDP Share—1997 |
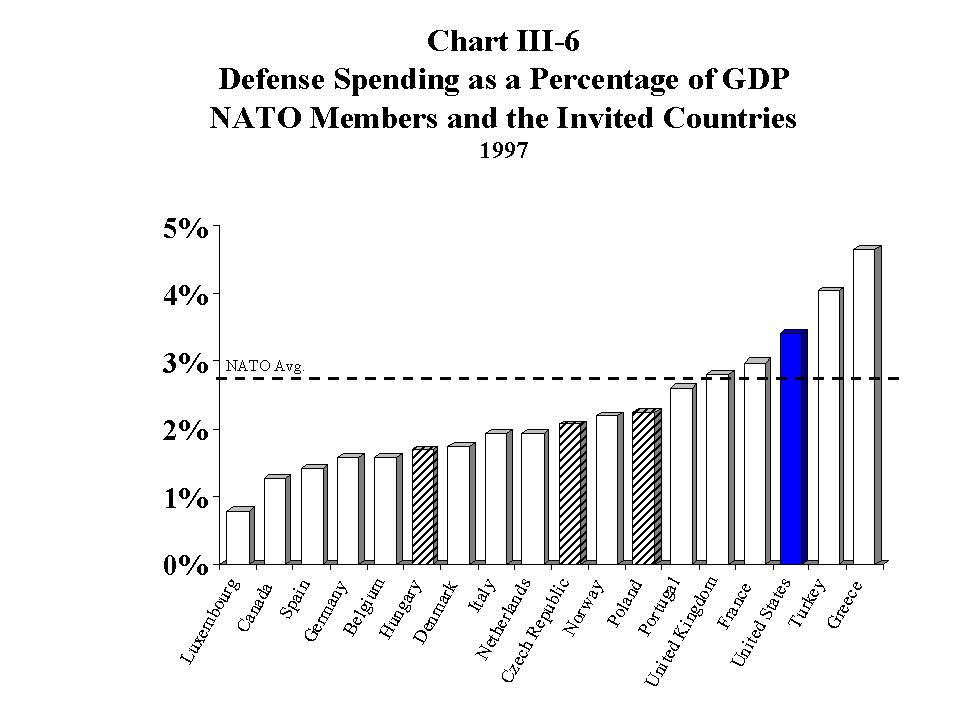
| Chart III–6 | Defense Spending As A Percentage of GDP—NATO Members and Invited Countries—1997 |
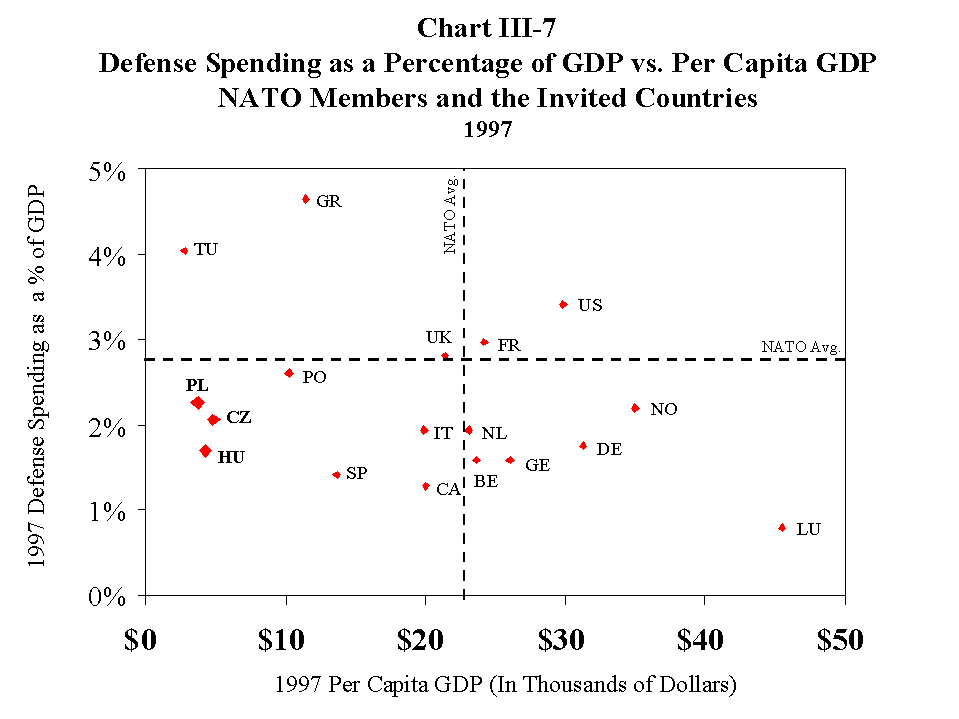
| Chart III–7 | Defense Spending As A Percentage of GDP vsPer Capita GDP—NATO Members and the Invited Countries—1997 |
| Chart III–8 | Country Contributions to ACE Rapid Reaction Corps |
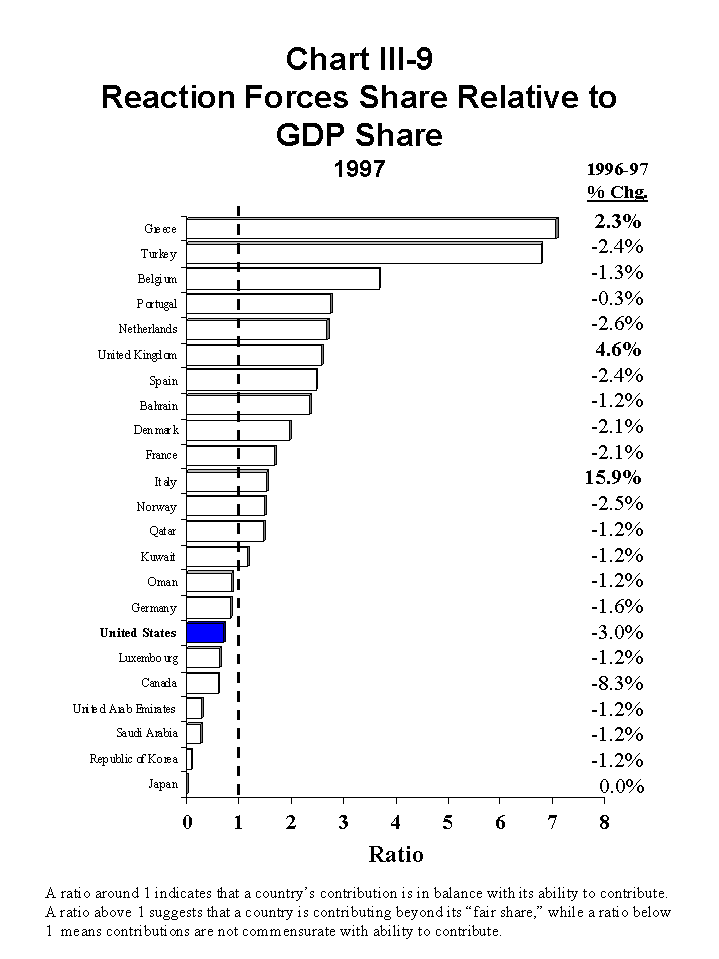
| Chart III–9 | Reaction Forces Share Relative to GDP Share—1997 |
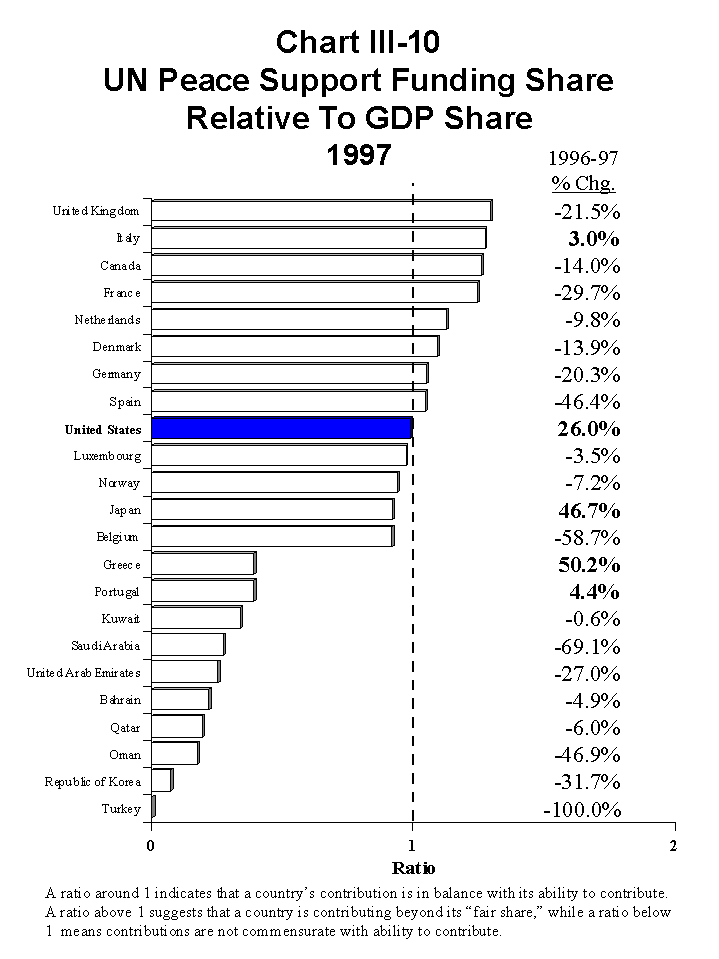
| Chart III–10 | UN Peace Support Funding Share Relative to GDP Share—1997 |
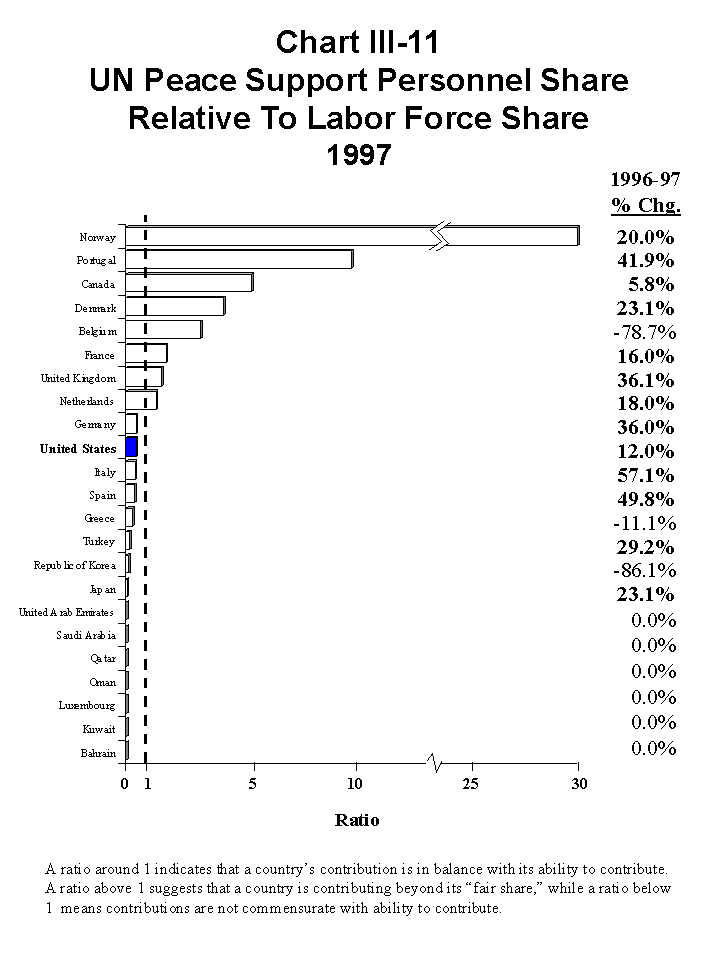
| Chart III–11 | UN Peace Support Personnel Share Relative to Labor Force Share—1997 |
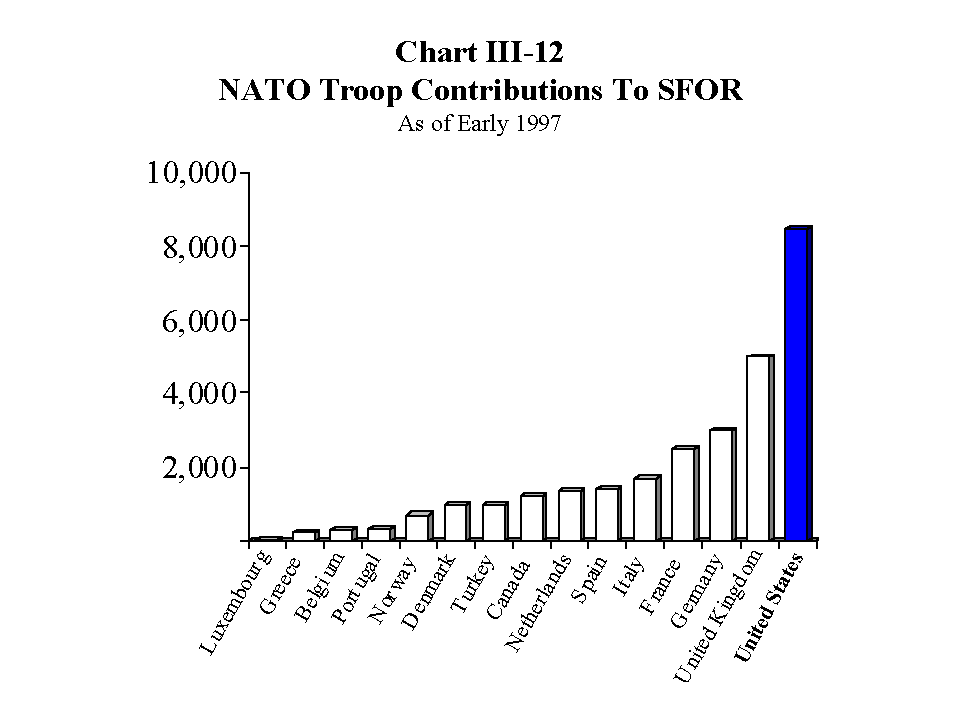
| Chart III–12 | NATO Troop Contributions To SFOR As Of Early 1997 |
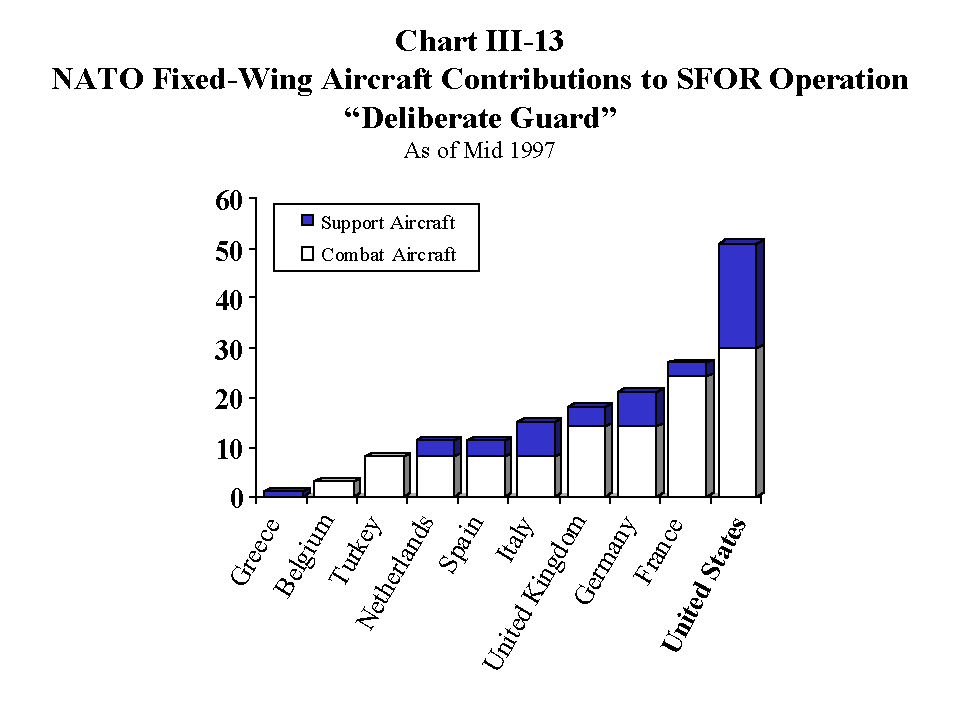
| Chart III–13 | NATO Fixed–Wing Aircraft Contributions to SFOR Operation "Deliberate Guard" As Of Mid 1997 |
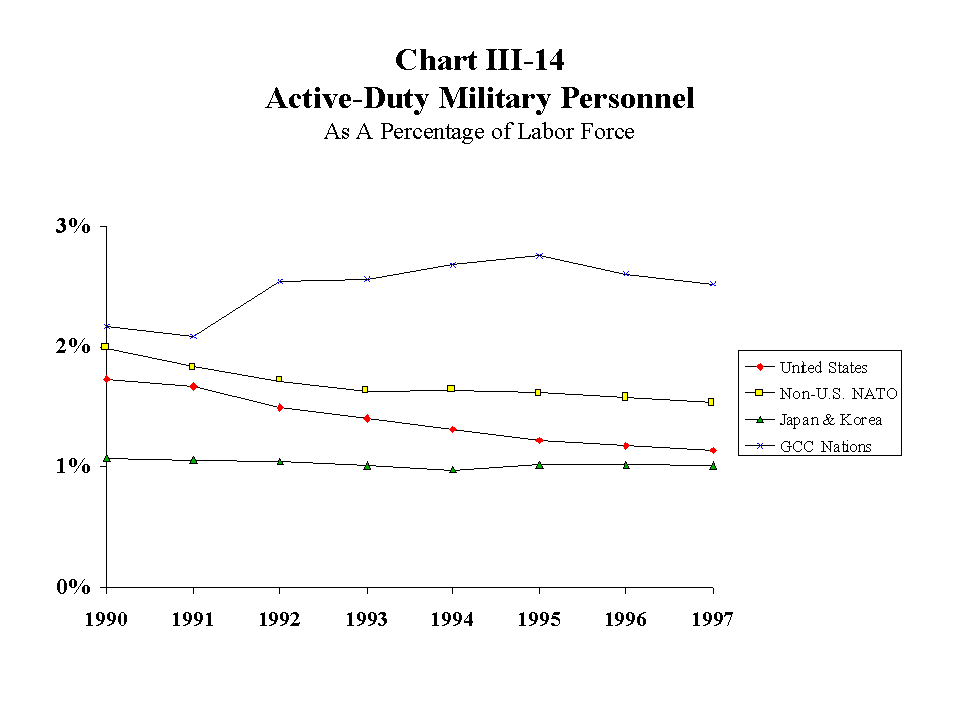
| Chart III–14 | Active Duty Military Personnel As A Percentage of Labor Force |
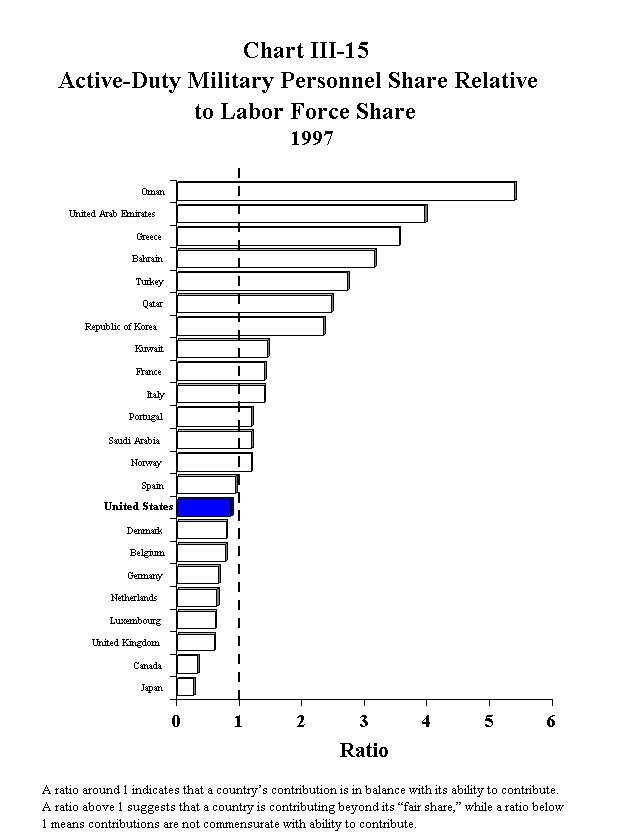
| Chart III–15 | Active Duty Military Personnel Share Relative to Labor Force Share—1997 |
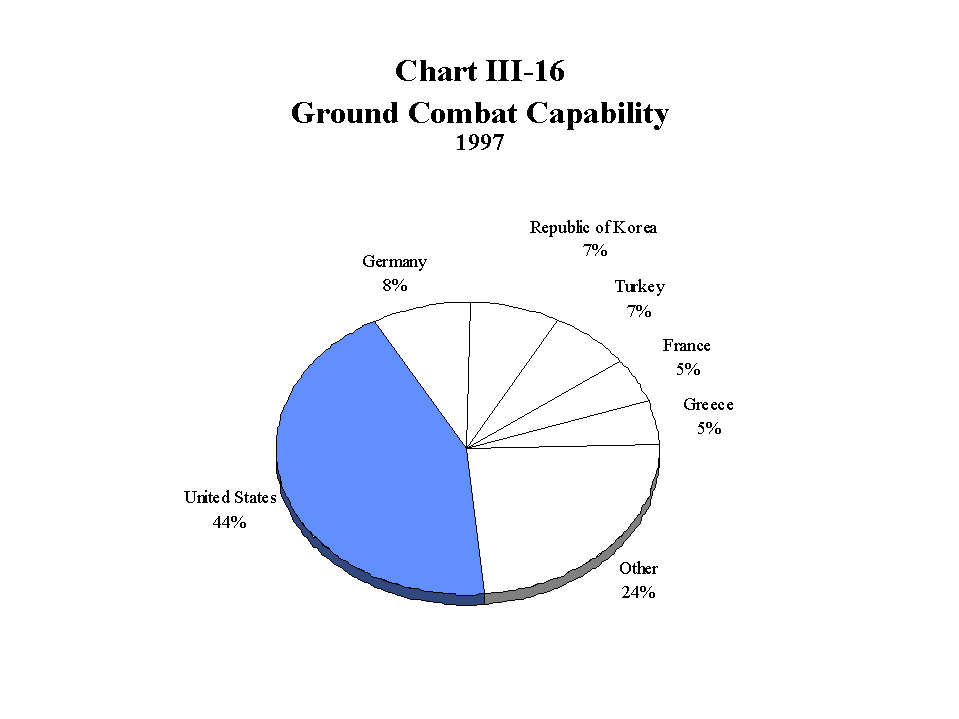
| Chart III–16 | Ground Combat Capability—1997 |
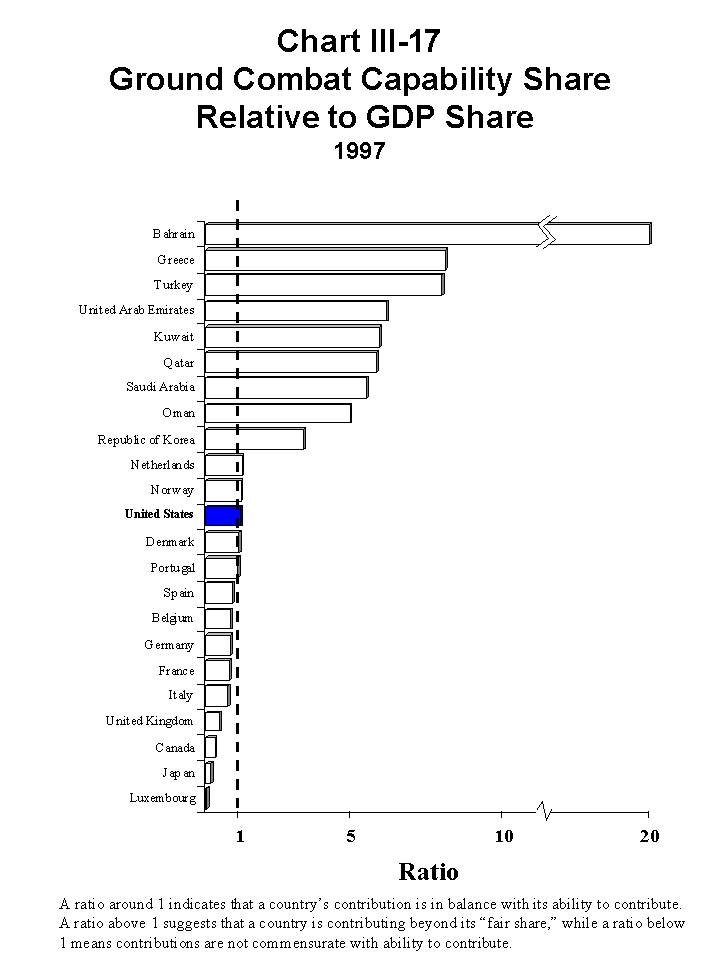
| Chart III–17 | Ground Combat Capability Share Relative to GDP Share—1997 |
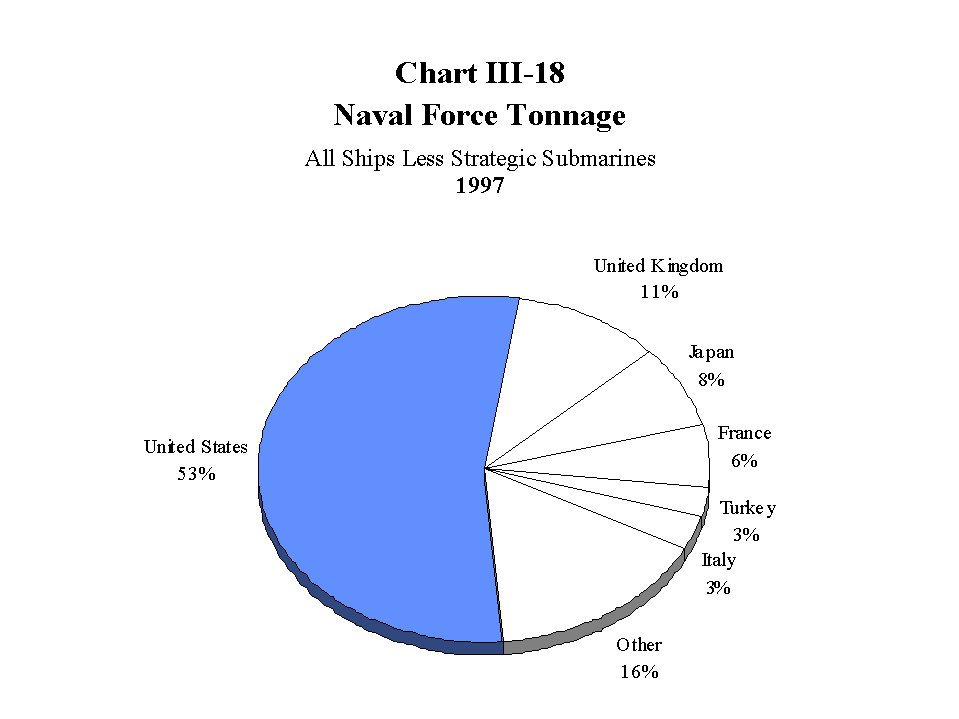
| Chart III–18 | Naval Force Tonnage—All Ships Less Strategic Submarines—1997 |
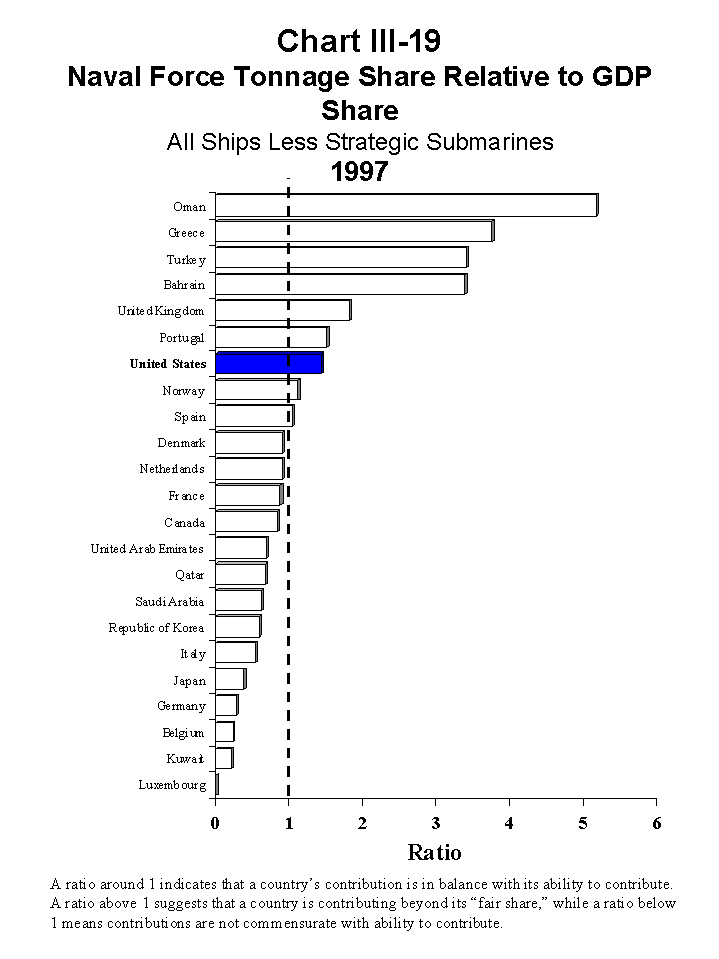
| Chart III–19 | Naval Force Tonnage Share Relative to GDP Share—All Ships Less Strategic Submarines—1997 |
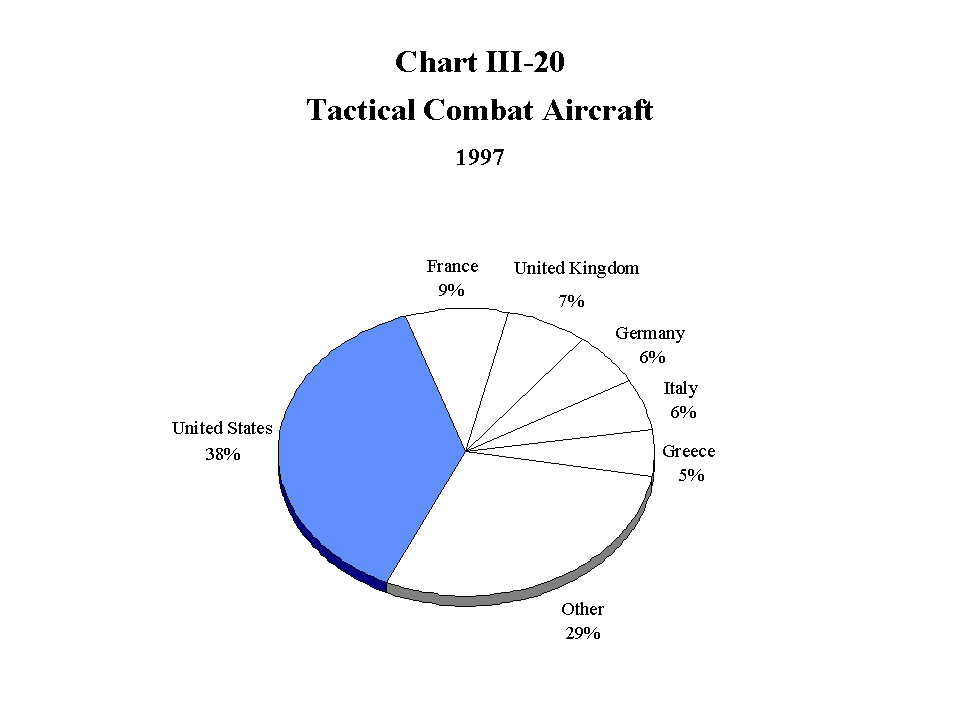
| Chart III–20 | Tactical Combat Aircraft—1997 |
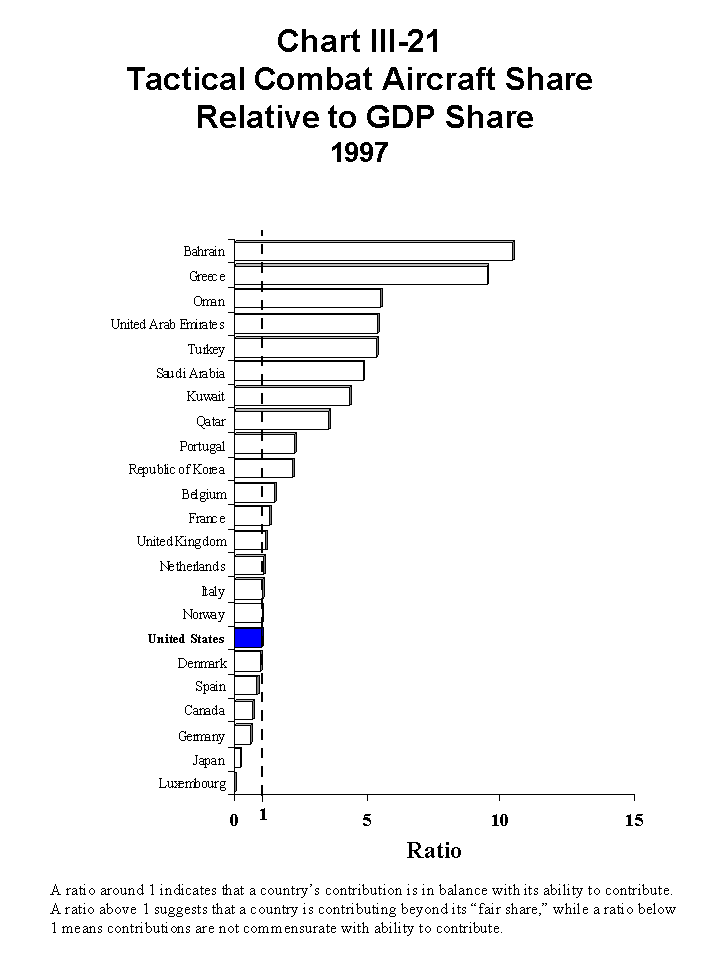
| Chart III–21 | Tactical Combat Aircraft Share Relative to GDP Share—1997 |
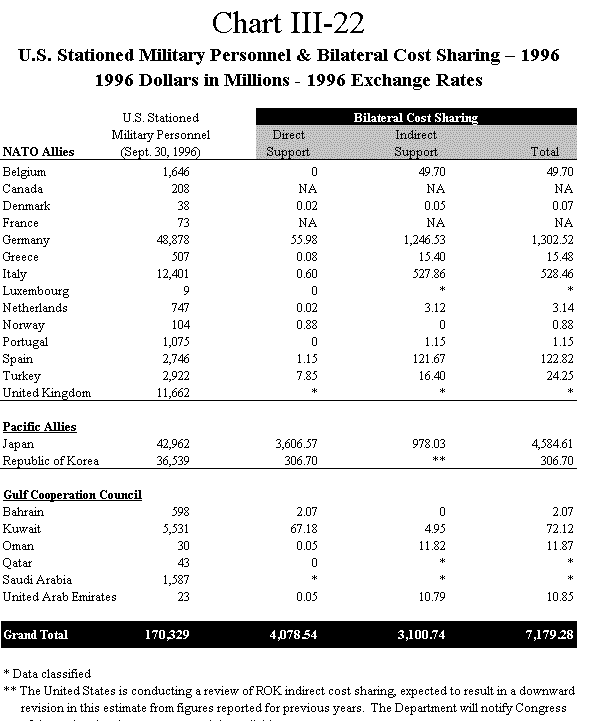
| Chart III–22 | U.S. Stationed Military Personnel & Bilateral Cost Sharing – 1996—1996 Dollars in Millions—1996 Exchange Rates |
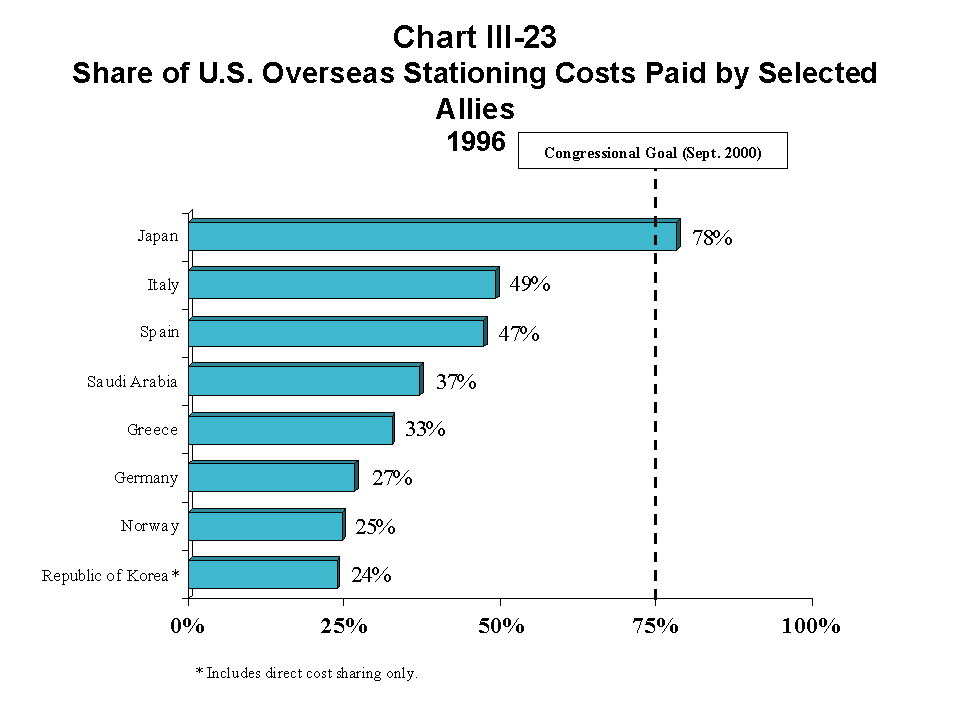
| Chart III–23 | Share of U.S. Overseas Stationing Costs Paid By Selected Allies—1996 |
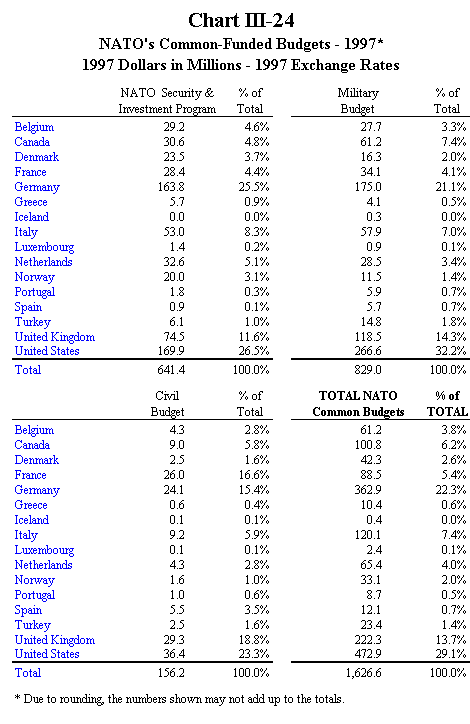
| Chart III–24 | NATO's Common–Funded Budgets – 1997—1997 Dollars in Millions—1997 Exchange Rates |
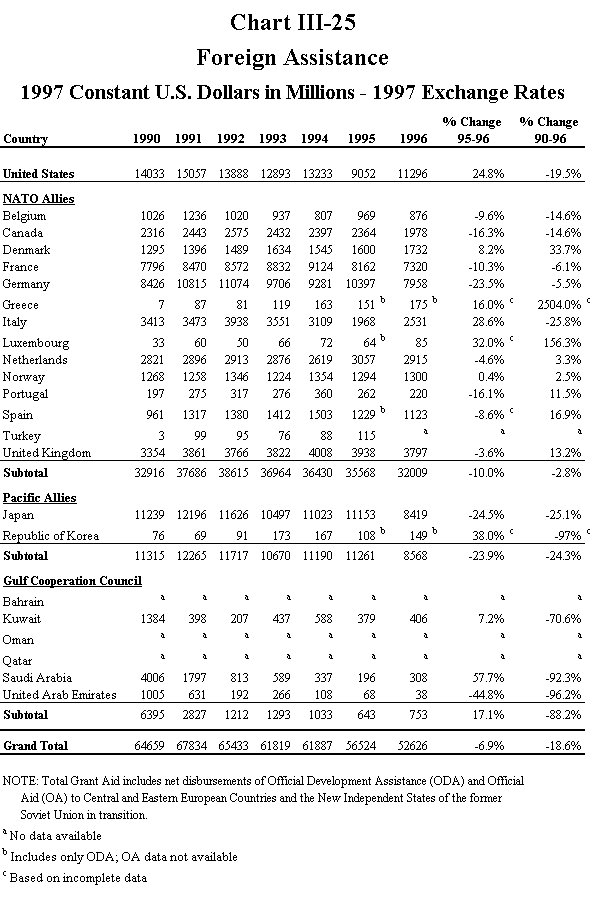
| Chart III–25 | Foreign Assistance – 1997—Constant U.S. Dollars in Millions—1997 Exchange Rates |
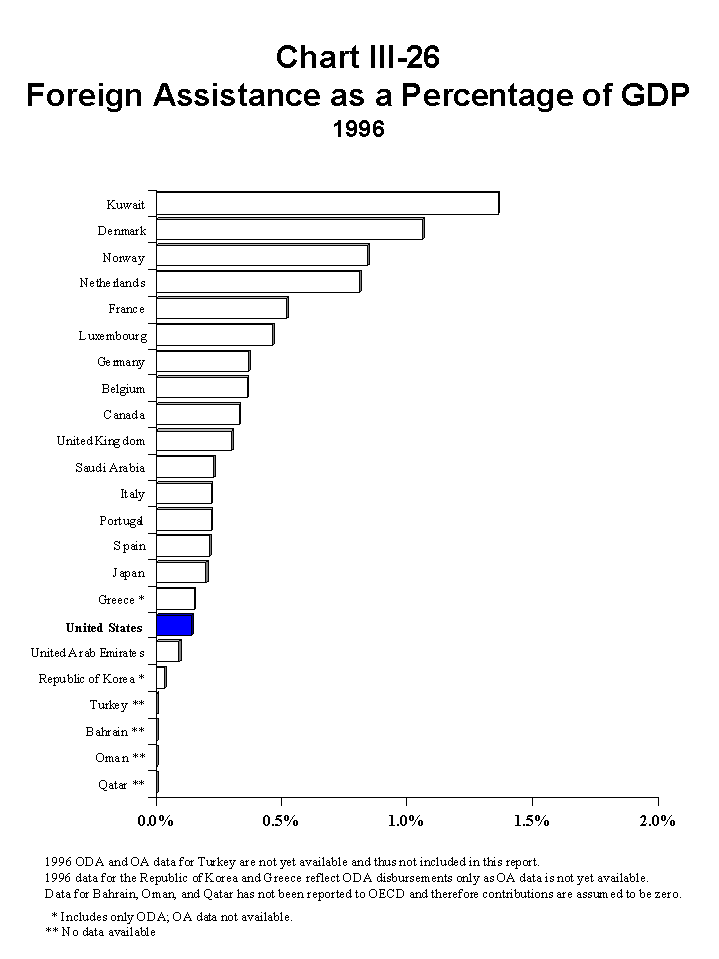
| Chart III–26 | Foreign Assistance as a Percentage of GDP—1996 |
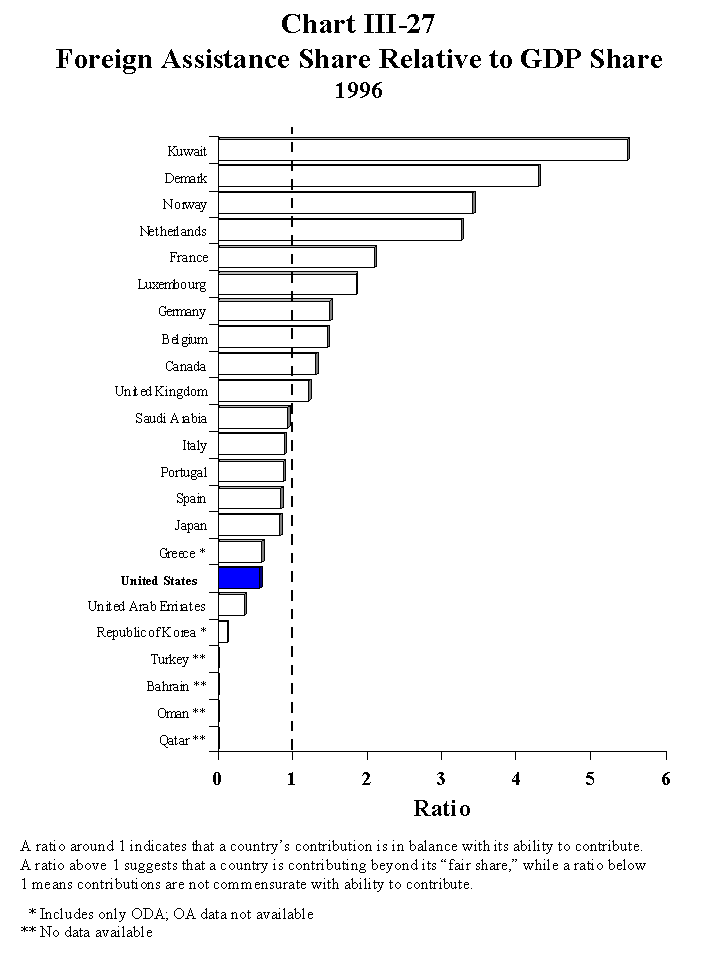
| Chart III–27 | Foreign Assistance Share Relative to GDP Share—1996 |
| Chart III–28 | Responsibility Sharing Indicators—Comparisons of Last Two Years of Available Data |