|
|
|
|
Report on Allied Contributions to the Common Defense
A Report to the United States Congress by the Secretary of Defense
U.S. Department of Defense
March 1998
III. Assessment of Country Contributions
This chapter presents the Department’s detailed assessment of allied and partner countries’ contributions to shared security objectives. Countries are assessed according to the criteria specified in the FY 1998 Defense Authorization Act, and also using additional measures and methodologies from past reports to ensure a comprehensive, balanced evaluation.
The responsibility sharing targets established by the FY 1998 Defense Authorization Act (P.L. 105–85, Section 1221) are listed below:
Increase military assets contributed to or earmarked for multinational military activities.
Increase offsets of U.S. stationing costs to a level of 75 percent by the year 2000.
Increase foreign assistance by 10 percent over the previous year, or to a level commensurate with that of the United States.
In addition to measuring country contributions against these short–term, “pass/fail” targets, this chapter also provides a more comprehensive assessment based on countries’ ability to contribute and reflecting trends in country efforts. Also included is an assessment of military personnel and standing forces as key measures of a country’s contribution to shared security objectives. Finally, although an assessment of U.S. efforts is not specified in the Authorization Act, this chapter addresses U.S. contributions for purposes of completeness and balance.
The following assessments are based on the most recent, complete, and reliable unclassified data available. Notes on uses and sources of these figures, and a country–by–country summary of selected responsibility sharing statistics, can be found in the Annex. A more complete compendium of supporting data is being prepared as a Statistical Appendix to this Report, and will be provided under separate cover.
The Department has long maintained that any attempt to assess responsibility sharing must consider nations’ contributions to the common defense in terms of their ability to contribute. This is a sound principle made all the more important by large differences in economic performance, population, and standards of living that exist among our allies.
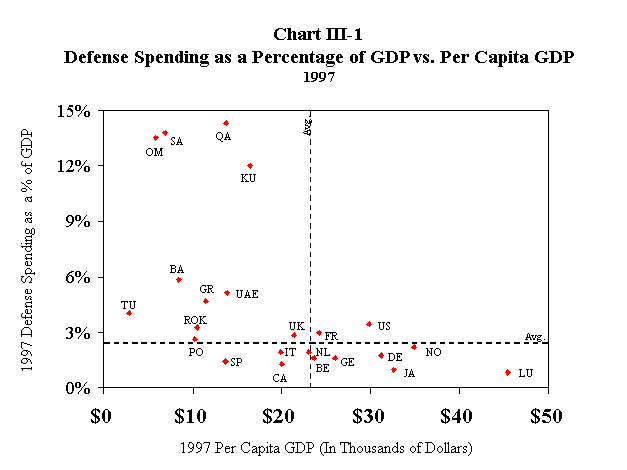
Chart III–1 shows the wide range of per capita GDP in 1997 among the nations addressed in this Report—from $2,800 in Turkey to over $45,000 in Luxembourg. In light of such disparities in standard of living, “equitable” defense spending among nations may not necessarily mean that each nation should devote the same level of its national wealth to defense. That is, it may be more “fair” for nations with the strongest economies and wealthiest populations to carry a proportionately larger share of the burden of providing for the common defense.
Chart III–1 shows, however, that most of the countries addressed in this Report that have below–average per capita GDP spend above–average shares on defense (such as all of the GCC countries, Greece, Turkey, and the Republic of Korea), while most of those that have above–average standards of living, spend below–average shares of their GDP for defense (including Luxembourg, Japan, Denmark, and Germany).
Chart III–1
Defense Spending as a Percentage of GDP vs. Per Capita GDP 1997
(view full–size chart)
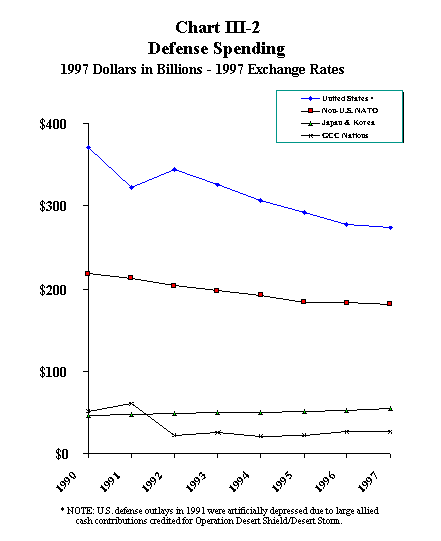
Chart III–2 depicts defense spending trends from 1990–1997 for the United States, our NATO and Pacific allies, and our GCC partners. The chart shows that over this period defense spending declines have been steepest for the United States, and that defense spending cuts by our NATO allies as a group have leveled off in recent years. Steady growth in defense expenditures is reflected for our Pacific allies and, following the Gulf War, for our GCC partners as well.
Budget pressures continue to strain defense programs in the United States and among our allies. Economic factors have exacerbated these pressures in Europe (rigorous European Monetary Union criteria and continuing high unemployment) and the Pacific (the recent financial crisis).
Excluding the GCC countries, whose defense spending in 1990–1991 was seriously distorted due to the Gulf War, combined real defense spending for nations addressed in this Report dropped by 20 percent between 1990 and 1997, reflecting adjustments to the post–Cold War security environment. Largest declines during this period were experienced by Germany (–30 percent), Canada (–28 percent), the United Kingdom and the United States (–27 percent each), and Belgium (–26 percent). In contrast, several nations achieved notable real increases in their defense budgets over this period – the Republic of Korea (33 percent), Turkey (23 percent), Luxembourg (19 percent), Japan (16 percent), Greece (14 percent), and Portugal (8 percent).
Between 1996 and 1997, nearly half of the countries addressed in this Report achieved real defense spending growth, with biggest gains posted by Qatar (46 percent), Portugal (9 percent), the Republic of Korea (7 percent), and Greece (5 percent).
Chart III–2
Defense Spending 1997 Dollars in Billions—1997 Exchange Rates
(view full–size chart)
Certain expenditures outside of defense budgets also promote shared security interests, and should be recognized—such as Germany’s investments in the infrastructure of eastern Germany and its financial support for economic and political reform in the new democracies in Central Europe. Nonetheless, it is essential that our allies maintain their defense budgets at appropriate levels, in order to ensure that they remain able to field effective military forces. In our discussions with allies and partners the Department continues to urge greater efforts in this area.
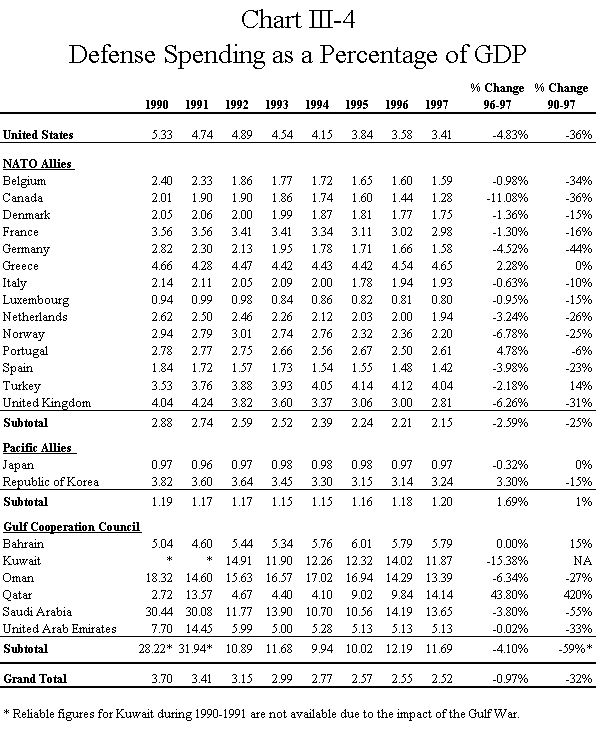
Defense Spending as a Percentage of GDP
Defense spending relative to GDP combines the most comprehensive indicator of defense effort with the most comprehensive indicator of ability to contribute. However, this indicator should not be viewed in isolation from other national contributions to shared security objectives.
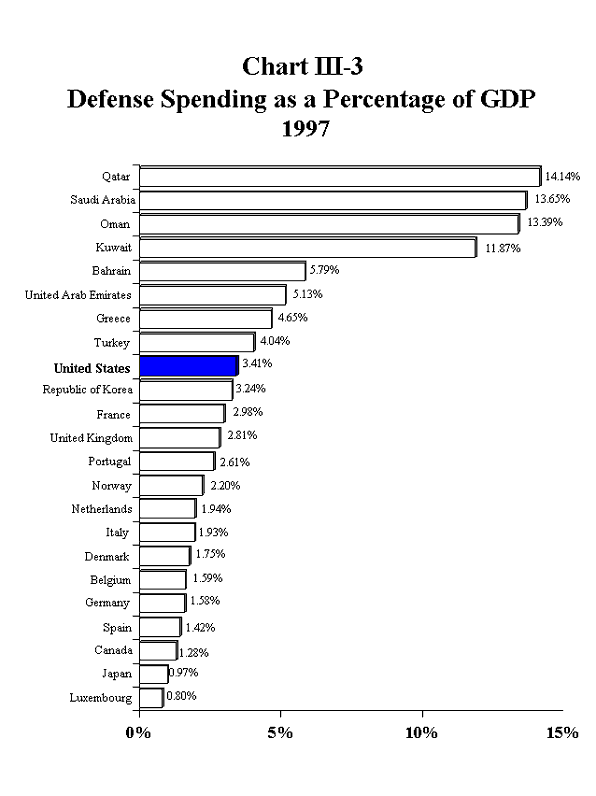
Chart III–3 shows the percentage of GDP spent on defense by the United States and our allies in 1997, while Chart III–4 presents similar data for the period since 1990. These charts reveal that the pattern reflected for 1997 remains much the same as it has been throughout the 1990s: the GCC nations, along with Greece and Turkey, spend the highest percentage of GDP on defense, while Japan, and several of our NATO allies (Luxembourg, Canada, Spain, Germany, Belgium, and Denmark) spend the lowest share of GDP on defense.
In 1997, Greece and Turkey once again exceeded all other NATO nations in defense spending relative to GDP, and Greece was also one of only two Alliance members that experienced growth in this indicator (2 percent) during 1997—the other was Portugal (5 percent).
Among NATO nations, France and the United Kingdom are consistently near the top in terms of defense spending as shares of GDP, trailing only Greece, Turkey, and the United States in this measure in 1997. On the other hand, Germany—which ranked sixth among NATO nations in this measure at the end of the Cold War—now ranks 12th, ahead of only Spain, Canada, and Luxembourg.
Although the percentage of GDP that Japan spent on its constitutionally–limited defense forces remained around just 1 percent in 1997, Japanese defense spending still recorded a 2.5 percent real increase over 1996 due to GDP growth. Japan’s defense budget remains the third largest of all the countries in this Report, behind those of the United States and France. The 7 percent real increase in the Republic of Korea’s defense spending in 1997 contributed to a 3 percent rise in its defense spending/GDP ratio.
The six GCC nations present a mixed picture in 1997. Qatar achieved a large jump in its share of GDP dedicated to defense, and now has the highest of any nation in this Report (14.1 percent). Ranked next are Saudi Arabia, Oman, and Kuwait, although each of these nations experienced declines in their defense/GDP ratio in 1997. Bahrain and the United Arab Emirates showed no change in defense spending as a share of GDP, which remained in the 5 to 6 percent range.
|
Chart III–3
Defense Spending as a Percentage of GDP 1997 |
Chart III–4
Defense Spending as a Percentage of GDP |
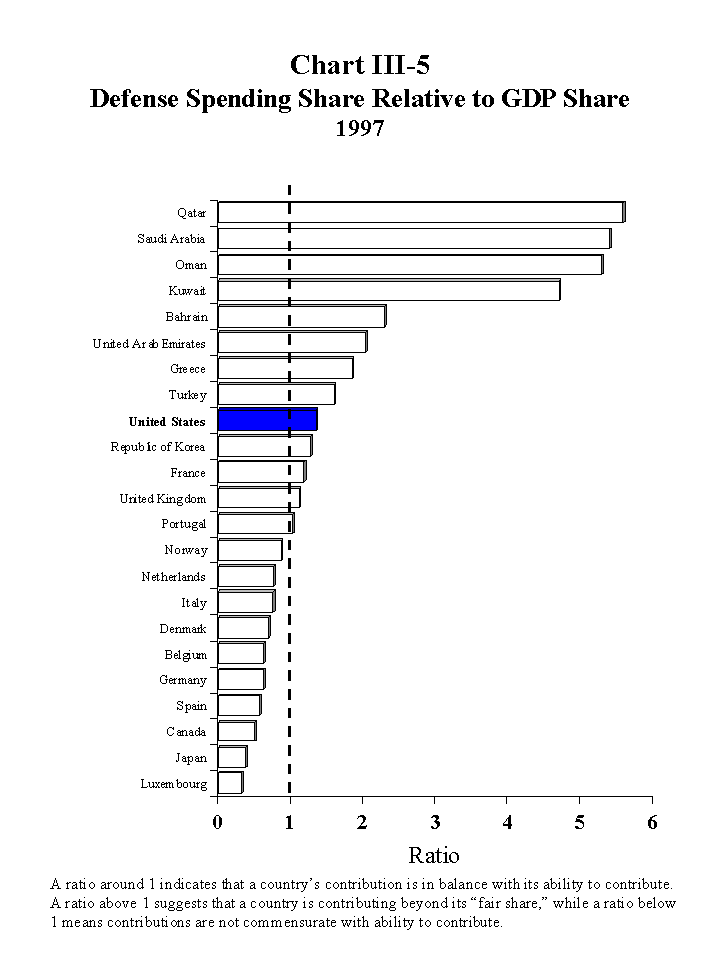
Chart III–5 presents the same picture as Chart III–3, but this time in terms of countries’ share of defense spending, compared to their share of total GDP. This approach helps to address the issue of equity, by showing countries with ratios at or near 1.0 to be doing their “fair share,” since their defense spending contributions are roughly in balance with their ability to contribute.
Chart III–5
Defense Spending Share Relative to GDP Share 1997
(view full–size chart)
On this basis, nations with defense spending shares substantially (i.e., 20 percent or more) above their relative ability to contribute in 1997 were all of the GCC countries led by Qatar, along with Greece, Turkey, the United States, the Republic of Korea, and France. The Netherlands and all those countries listed beneath it in Chart III–5 made significantly below average defense spending contributions in 1997 relative to their ability to contribute.
Assessment of Defense Spending Contributions
In the FY 1998 Defense Authorization Act, Congress established two targets for our allies in the area of defense spending relative to GDP: increase this ratio by 10 percent compared to the preceding year, or achieve a level of defense spending as a percentage of GDP at least commensurate with that of the United States. In 1997, eight nations addressed in this Report met one or both of these targets: Qatar achieved an increase greater than 10 percent in its share of GDP devoted to defense, while all GCC nations, along with Greece and Turkey, registered shares of GDP for defense greater than that of the United States.
The targets embodied in the FY 1998 Defense Authorization Act are a sound basis upon which to assess country efforts, although the Department believes that a thorough evaluation requires a somewhat expanded approach. The Department has long maintained that—in contrast to the short–term, “pass/fail” perspective of the Congressional targets—assessments should be based on a country’s ability to contribute, and acknowledge trends in country efforts.
From this broader perspective, the Department assesses that—in addition to the eight countries identified above—additional nations are making substantial responsibility sharing contributions in the area of defense spending. These are the United States, the Republic of Korea, and France, which again in 1997 achieved significantly above–average shares of defense spending relative to their share of GDP.
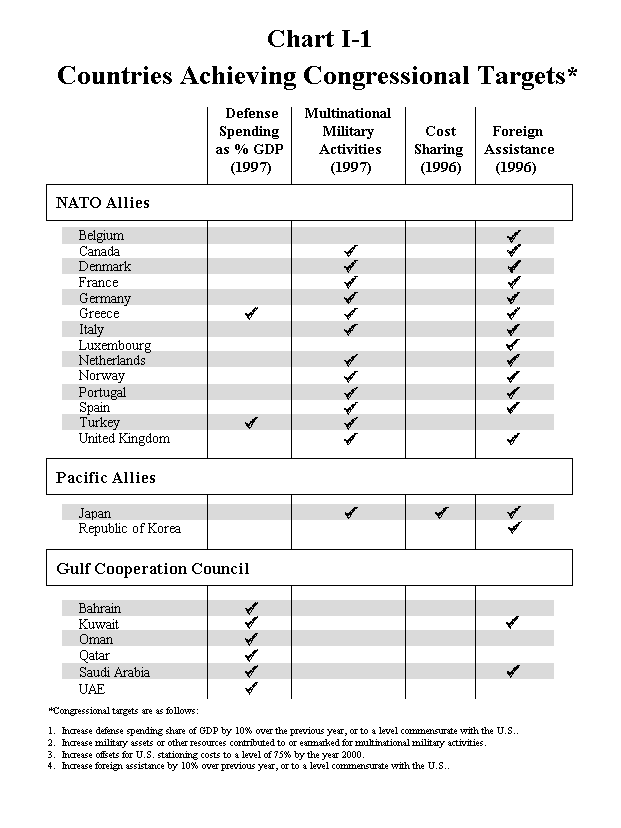
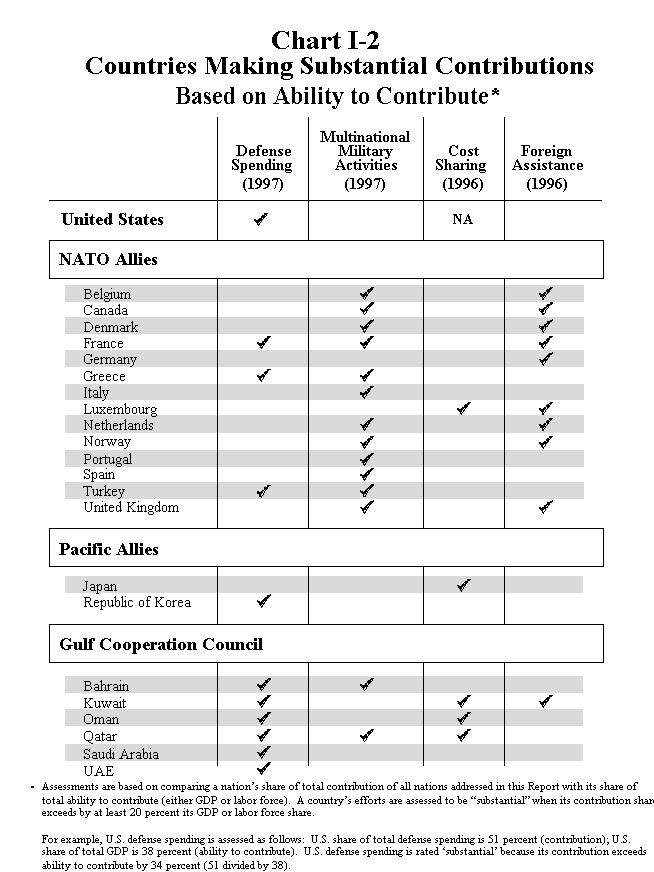
These assessments are summarized in Charts I–1 and I–2.
Finally in the area of defense spending, Luxembourg, Japan, and Portugal (in addition to Turkey, Greece, and the Republic of Korea discussed above) deserve mention as the only countries in this Report which have sustained real growth in defense spending since the end of the Cold War.
Contributions of Countries Invited to Join NATO
At the Madrid summit in July 1997, NATO agreed to extend invitations to the Czech Republic, Hungary, and Poland to begin accession negotiations. Subsequently, at the December meeting of the North Atlantic Council, NATO foreign ministers signed protocols of accession with the three invited nations, opening the way for national legislatures to begin ratification proceedings. Once the protocols are ratified by all NATO nations, the three invited states will be allowed to accede to the North Atlantic Treaty.
As NATO invitees, the Czech Republic, Hungary, and Poland would not normally be covered by this Report. However, in order to provide some context for assessing the relative defense effort of these nations, there follows a brief comparison of their defense spending contributions and ability to contribute, relative to those of the United States and other current NATO members.
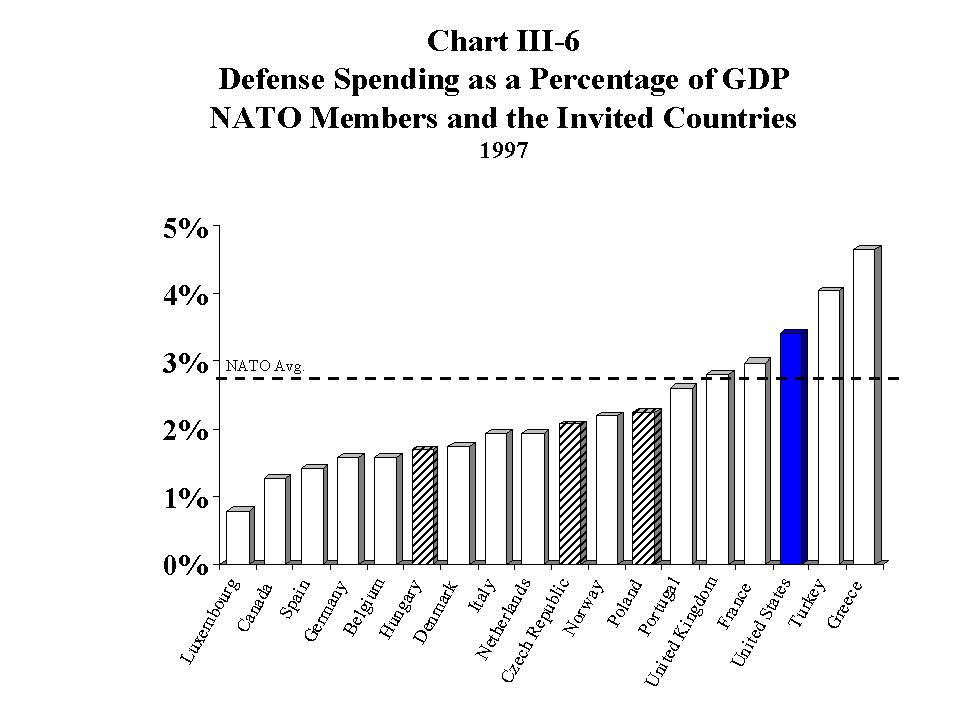
Chart III–6 is a variation on Chart III–3, comparing percentages of GDP devoted to defense for the three invited states to those of the NATO nations. The chart shows that in 1997 the three invited countries spent a percentage of GDP on defense below the NATO average.
Chart III–6
Defense Spending As A Percentage of GDP NATO Members and Invited Countries 1997
(view full–size chart)
To achieve a more balanced view of this statistic, however, it is useful to consider the added dimension of standard of living. This is done in Chart III–7, which shows for all NATO nations and the three invited states how their respective defense effort (measured by defense spending as a share of GDP) relates to their standard of living (measured by GDP per capita). In light of the very modest per capita GDP of the three invited countries, their GDP share devoted to defense takes on a more favorable perspective.
Chart III–7
Defense Spending As A Percentage of GDP vs. Per Capita GDP NATO Members and the Invited Countries 1997
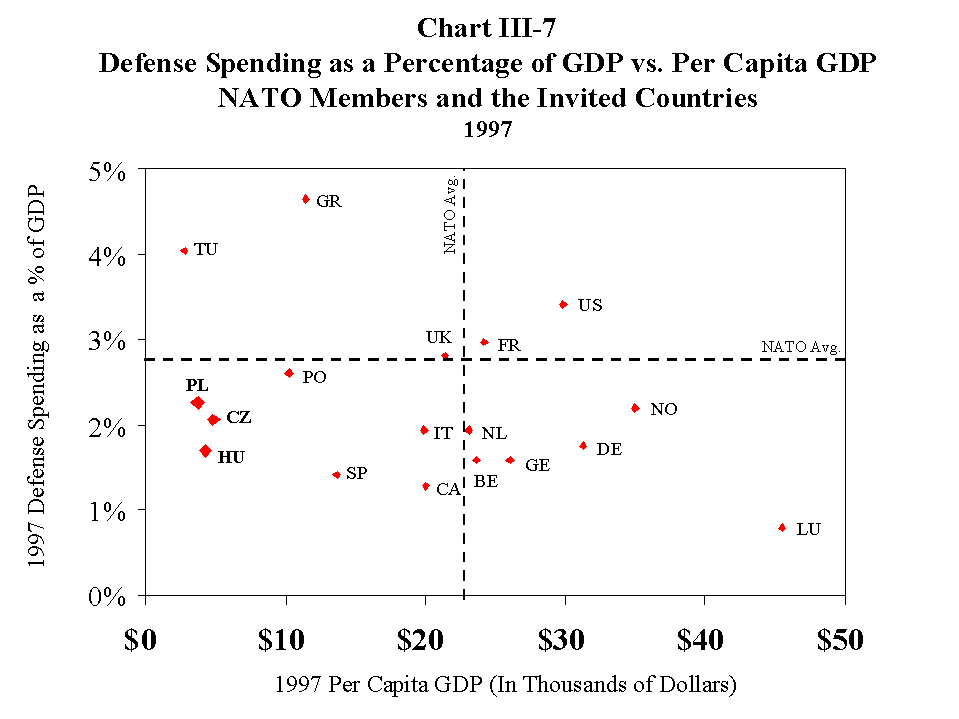
(view full–size chart)
Multinational Military Activities
As highlighted in the current national security strategy (May 1997), a diverse set of political, economic, and ethnic instabilities continues to threaten regions of vital strategic interest to the United States. Our strategy consists of three principal objectives—to shape the security environment, respond to potential crises, and prepare to meet future uncertainties. A key element in this integrated approach is to maintain and improve our ability, and that of our allies, to engage in multinational peacekeeping and humanitarian relief operations, as has been done on an unprecedented scale since the end of the Cold War. During 1997, for example, U.S. and allied military personnel served in such operations in Bosnia and Herzegovina, Croatia, Macedonia, Cyprus, Golan Heights, along the India–Pakistan border, the Iraq–Kuwait border, and in Lebanon, Georgia, Tajikistan, Haiti, Western Sahara, and Angola.
The Department’s assessment of countries’ contributions to multinational military activities addresses the commitment of specialized forces to multinational defense missions, as well as participation in and funding for UN peace support operations.
Forces Dedicated to Multinational Missions
Of the countries in this Report, our NATO allies make by far the most substantial contribution of specialized units earmarked for multinational missions. As part of NATO’s post–Cold War strategic concept, Alliance members have begun to develop forces that can be rapidly transported to remote theaters of operations; function despite a lack of pre–established lines of communication and host nation support; and fight effectively in multinational formations at the corps and even division level. NATO has organized these capabilities into Reaction Forces, including multinational commands and formations such as the Allied Command Europe (ACE) Mobile Force (Land) and the ACE Rapid Reaction Corps (ARRC) (see Chart III–8) for ground forces, and the Immediate and Rapid Reaction air forces.
Additionally, NATO maintains standing maritime Immediate Reaction Forces in the Atlantic and the Mediterranean. The standing force in the Atlantic of six destroyers and frigates has a crew of 1,700 and air defense, anti–submarine warfare, and anti–surface warfare capabilities. Canada, Germany, the Netherlands, the United Kingdom and the United States are the five permanent contributors to the standing force with Spain currently providing a frigate as the sixth ship. In addition, STANAVFORLANT’s strength can be augmented by units from Belgium, Denmark, Portugal, and Norway for short periods of time.
In addition to units dedicated to NATO’s Reaction Forces, Alliance members also contribute forces to other multinational rapid deployment formations. These additional reaction forces include the Eurocorps (with a Franco/German brigade, a Belgian mechanized division, German and French armored divisions, and a Spanish mechanized brigade), and the UN Rapid Reaction Force (consisting of a British/French/Dutch multinational brigade as well as combat support elements). France maintains, in addition to the units mentioned above, a 56,000 man four–division rapid deployment force (Force d’Action Rapide). Finally, the Western European Union has organized a Contingency Maritime Force consisting of naval assets of member nations.
| NATO Member | Combat Brigade Equivalents | Non–Organic Support Brigade Equivalents |
| Belgium | 1 | |
| Canada | 0.1 | |
| Denmark | 1 | 0.2 |
| Germany | 3 | |
| Greece | 3 | |
| Italy | 4 | 1.8 |
| Netherlands | 1 | 0.7 |
| Portugal | 1 | |
| Spain | 3.3 | |
| Turkey | 3 | 0.1 |
| United Kingdom | 7 | 9.9 |
| United States | 3 | 2.7 |
| TOTAL | 30.3 | 15.5 |
The experience gained by NATO’s Reaction Forces in the former Yugoslavia, and the development of NATO’s Combined Joint Task Force (CJTF) concept, clearly demonstrate that the integrated planning and operational framework of the Alliance provides substantial multinational military capability for contingencies worldwide.
In contrast, due to the much different security situation in the Pacific and the unique defense capabilities of Japan and the Republic of Korea, our responsibility sharing policy in this region has emphasized cost sharing rather than global military roles and missions. Nevertheless, we are encouraged by Japan’s 1995 agreement to increase its role in regional affairs, and by the Republic of Korea’s steady force modernization and assumption of increased command responsibilities for combined U.S.–ROK forces. Additionally, in 1995 the Republic of Korea concluded a Standby Arrangement for UN Peacekeeping Operations that would make available an Infantry Battalion, an Engineering Battalion, and a Medical Support Unit (a total of up to 800 troops) for rapid deployment in support of UN Peacekeeping Operations.
With the encouragement of the United States, our GCC partners are taking steps to strengthen provisions for multilateral defense of their region by expanding their standing Peninsula Shield force (which presently consists of 10,000 men based in Saudi Arabia), and increasing the frequency of multinational exercises. In addition, the GCC states have made progress toward implementing an integrated air defense system. The United States is also working with the GCC to overcome impediments to closer military cooperation with other Arab nations.
To allow more direct comparisons among nations, and to address the issue of equity of contributions, Chart III–9 depicts each nation’s share of multinational contingency forces (average for ground, naval, and air forces) in relation to its share of GDP. Percentage changes in each country’s ratio from 1996 to 1997 are also indicated in the chart, and show that in the last year Italy achieved a notable increase, with more modest gains registered by the United Kingdom and Greece. Most of the rest of the countries in this Report saw declines in this ratio from 1996 to 1997, although these decreases were modest in all cases except Canada (8 percent).
Chart III–9
Reaction Forces Share Relative to GDP Share 1997
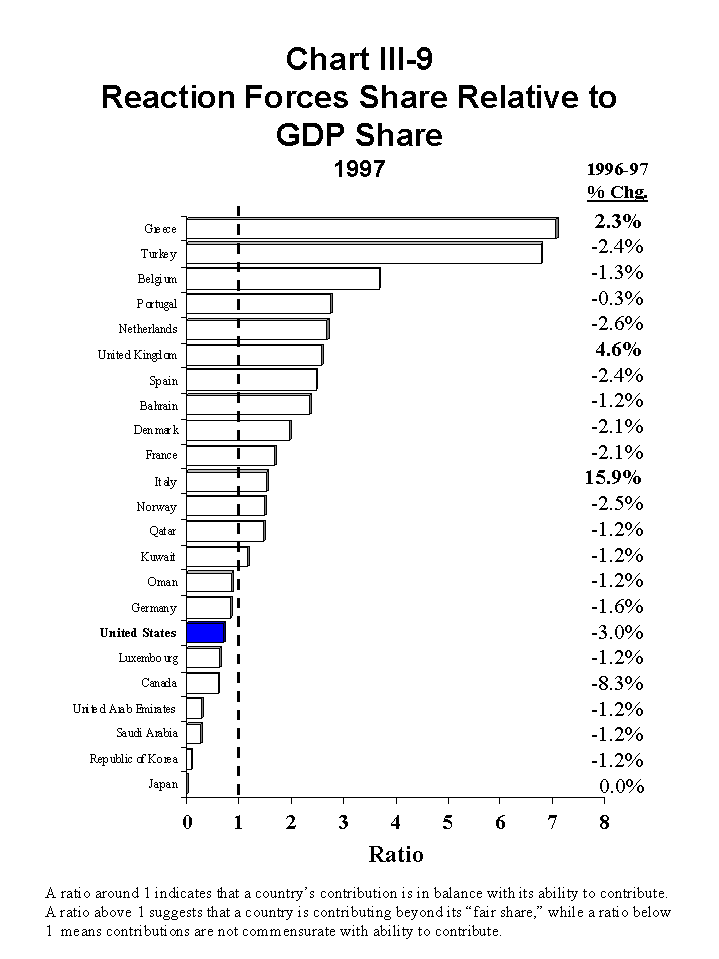
(view full–size chart)
The chart also indicates that more than half the nations in this Report had shares of multinational contingency forces significantly (at least 20 percent) greater than their GDP shares, led by Greece and Turkey, and including Belgium, Portugal, the Netherlands, the United Kingdom, Spain, Bahrain, Denmark, France, Italy, Norway, and Qatar.
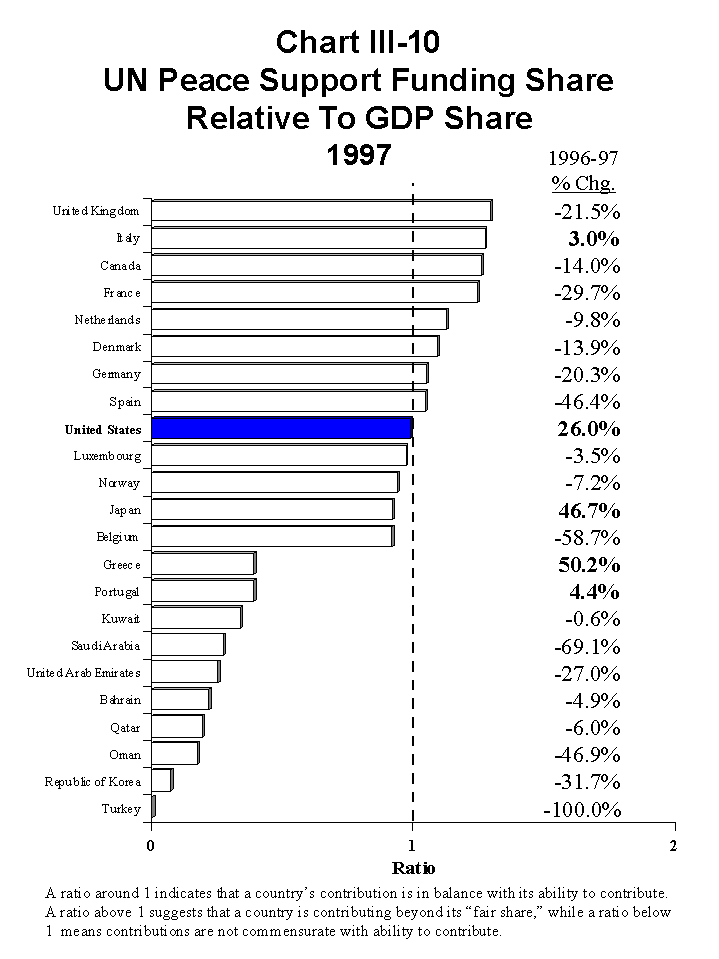
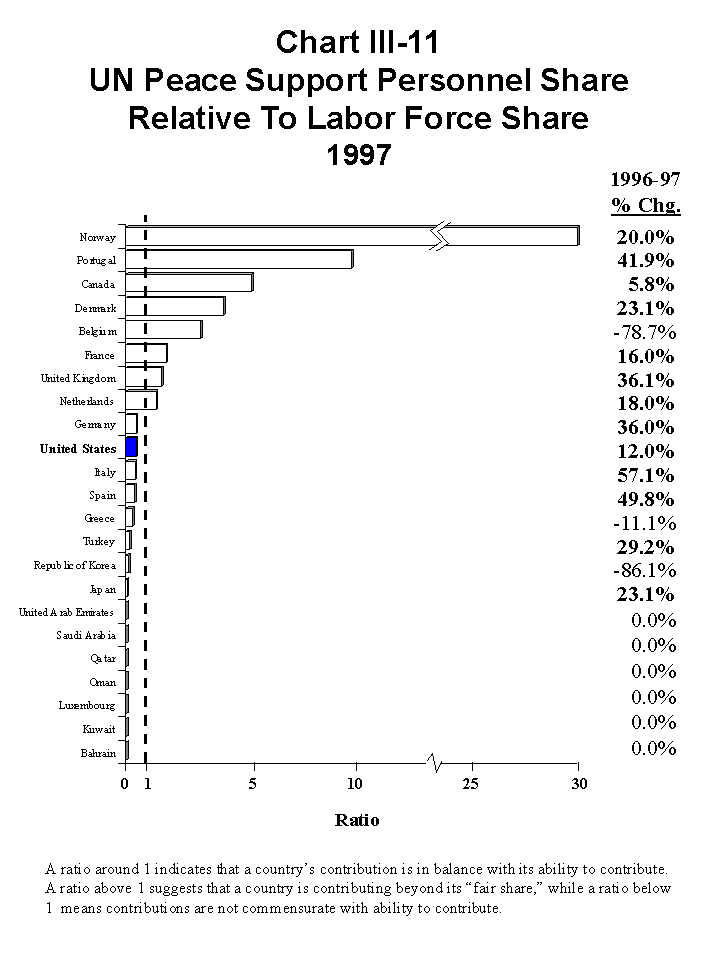
Participation in and Funding for UN Peace Support Operations
A number of our NATO allies make very substantial contributions to UN peace support operations relative to their ability to contribute. This is shown in Chart III–10 (which depicts each nation’s share of total funding contributed for peacekeeping missions compared to its share of total GDP) and Chart III–11 (which depicts each nation’s share of total manpower contributed to peacekeeping missions compared to its share of total labor force).
|
Chart III–10
UN Peace Support Funding Share Relative to GDP Share 1997 |
Chart III–11
UN Peace Support Personnel Share Relative to Labor Force Share1997 |
NATO–led Stabilization Force (SFOR) in Bosnia and Herzegovina
After elections were held in September 1996, the NATO–led Implementation Force (IFOR) successfully completed its missions. However, it became clear that much more needed to be accomplished to help ensure lasting security and stability in the region. As a result, NATO agreed to organize a Stabilization Force (SFOR) whose primary mission would be to maintain the secure environment necessary for the consolidation of peace. Its specific tasks are:
To consolidate IFOR’s achievements and promote a climate in which the peace process can continue to move forward;
To provide selective support to civilian organizations within its capabilities.
Under UN Security Council Resolution 1088 of 12 December 1996, SFOR was authorized to implement the military aspects of the Dayton Peace Agreement as the legal successor to IFOR. Like IFOR, SFOR operates under Chapter VII of the UN Charter (peace enforcement). SFOR rules of engagement call for the robust use of force, if necessary to accomplish its mission and to protect itself.
Since the operation began, SFOR has patrolled the 1,400 km long Zone of Separation (ZOS), monitored hundreds of weapon containment sites, confiscated weapons, monitored training and movement activities by the Parties’ armies, monitored their de–mining activities, and removed unauthorized checkpoints.
SFOR has also been involved in non–military activities such as the repair and maintenance of roads, bridges, airports, and railroads. SFOR has supported other international organizations to maintain a secure environment for elections, return refugees and displaced persons, promote local law and order, and provide technical advice and assistance.
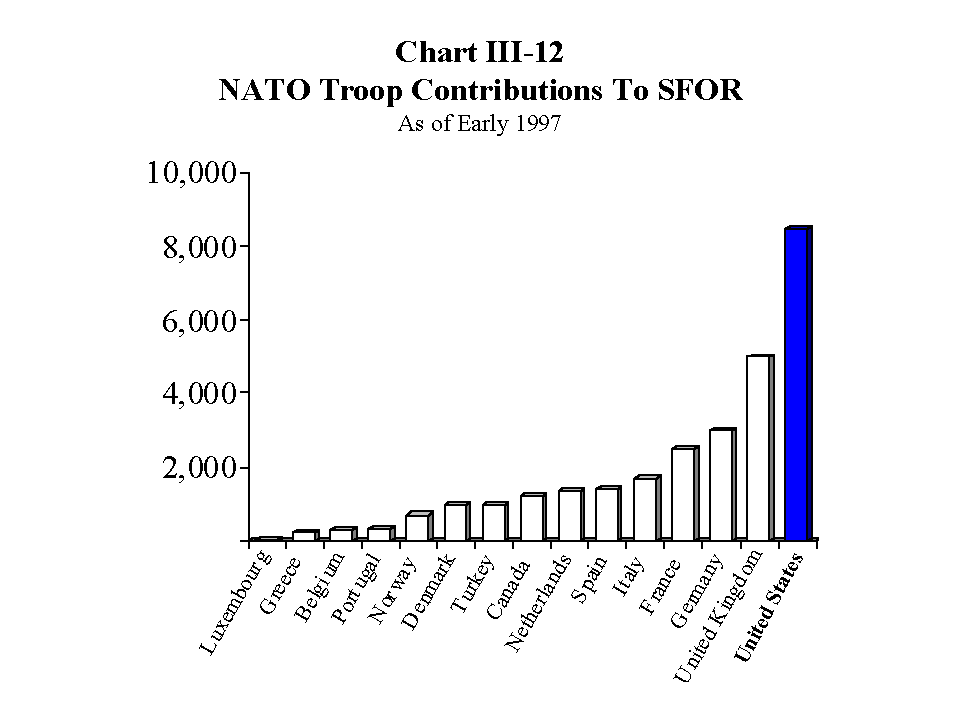
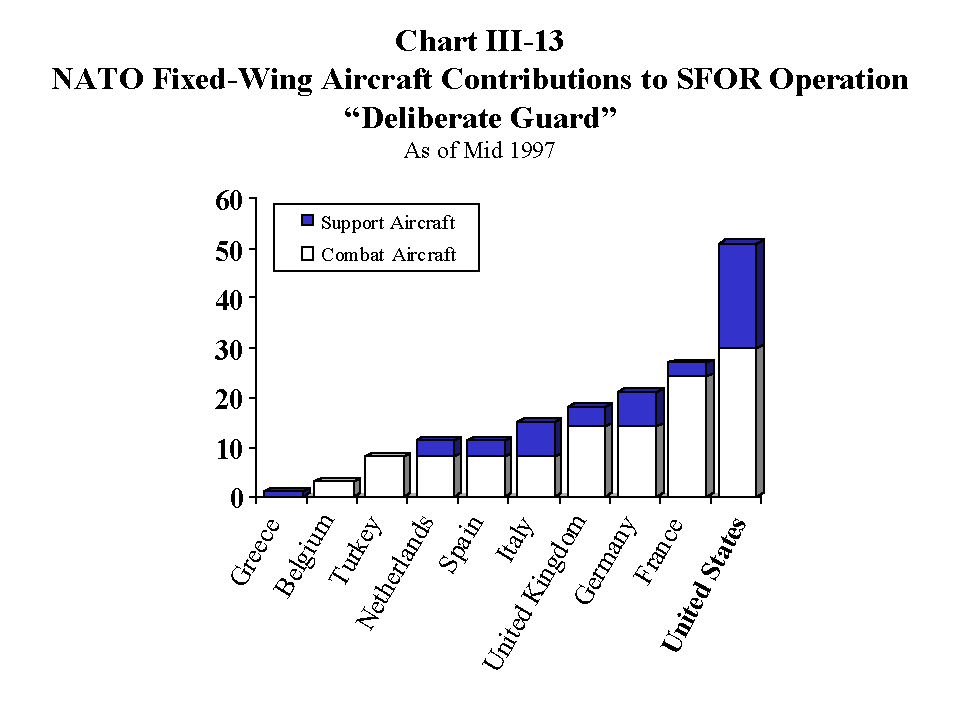
In 1997, there were approximately 35,000 troops in Croatia and Bosnia–Herzegovina. This includes a total of 29,000 troops from NATO member countries, as well as 6,000 troops from 20 non–NATO countries (of which 15 are in the Partnership for Peace). Chart III–12 shows that as of early 1997 the United States provided 8,500 troops, the United Kingdom (5,000), Germany (3,000), and France (2,500). Furthermore, fixed–wing aircraft have been involved in thousands of sorties since the SFOR mission started. Chart III–13 indicates that as of mid–1997, the largest number of aircraft contributed by NATO nations were by the United States (51), France (27), Germany (21), and the United Kingdom (18).
As in IFOR, NATO has assumed primary funding responsibility for SFOR. Contributions include national funding, as well as common funding through NATO’s Military Budget and the NATO Security Investment Program.
|
Chart III–12
NATO Troop Contributions To SFOR As Of Early 1997 |
Chart III–13
NATO Fixed–Wing Aircraft Contributions to SFOR Operation “Deliberate Guard" As Of Mid 1997 |
These charts indicate that the United Kingdom, Canada, and France each make funding and personnel contributions to UN peacekeeping missions that are substantially (at least 20 percent) greater than their share of GDP and labor force. Italy also makes substantial peacekeeping funding contributions relative to its GDP share. Other major contributors of peacekeeping personnel relative to ability to contribute include Norway, Portugal, Denmark, Belgium, and the Netherlands. The funding and personnel contributions of our remaining NATO and Pacific allies are average or below par, while the level of support provided by the GCC nations is extremely low.
Compared to 1996, Japan, Italy, Portugal, and the United States registered increases in their shares of both funding support and personnel relative to their ability to contribute. Greece also achieved an increase from the previous year in its funding support ratio. Other nations with increases in their personnel support ratio are Spain, the United Kingdom, Germany, Turkey, Denmark, Norway, the Netherlands, France, and Canada.
Assessment of Multinational Military Contributions
In the FY 1998 Defense Authorization Act, Congress established the objective for U.S. allies to increase the assets (including personnel, equipment, logistics, and support) that they contribute, or are prepared to contribute, to multinational military activities worldwide. Based on the foregoing analysis, the Department assesses that from 1996 to 1997 Italy, the United Kingdom, and Greece have increased their contribution to multinational military forces relative to their ability to contribute. Similarly, Japan, Italy, Portugal, Greece, Spain, the United Kingdom, Germany, Turkey, Denmark, Norway, the Netherlands, France, and Canada increased their share of personnel and/or funding support for UN peace operations relative to their ability to contribute.
As described elsewhere in this Report, the Department takes a broader perspective in making evaluations of this type, and recognizes those countries whose contribution shares toward multinational military activities substantially exceed their share of GDP or labor force. On this basis, Greece, Turkey, Belgium, Portugal, the Netherlands, the United Kingdom, Spain, Bahrain, Denmark, France, Italy, Norway, and Qatar make notable contributions to multinational contingency forces. Likewise, the United Kingdom, Canada, France, Denmark, the Netherlands, Norway, Belgium, Portugal, and Italy make substantial contributions to UN peace support efforts relative to their ability to contribute.
These assessments are summarized in Chart I–1 and Chart I–2.
Military Personnel
Although they go beyond the specific requirements of the FY 1998 Defense Authorization Act, this section and the next provide an analysis of allies’ military personnel and forces. Congressional interest in these categories is focused on that subset that is committed or can be committed to multinational expeditionary missions. The Department shares this emphasis, but believes that a nation’s total contributions of personnel and forces is also a valid indicator of its commitment to shared security objectives such as deterrence and stability.
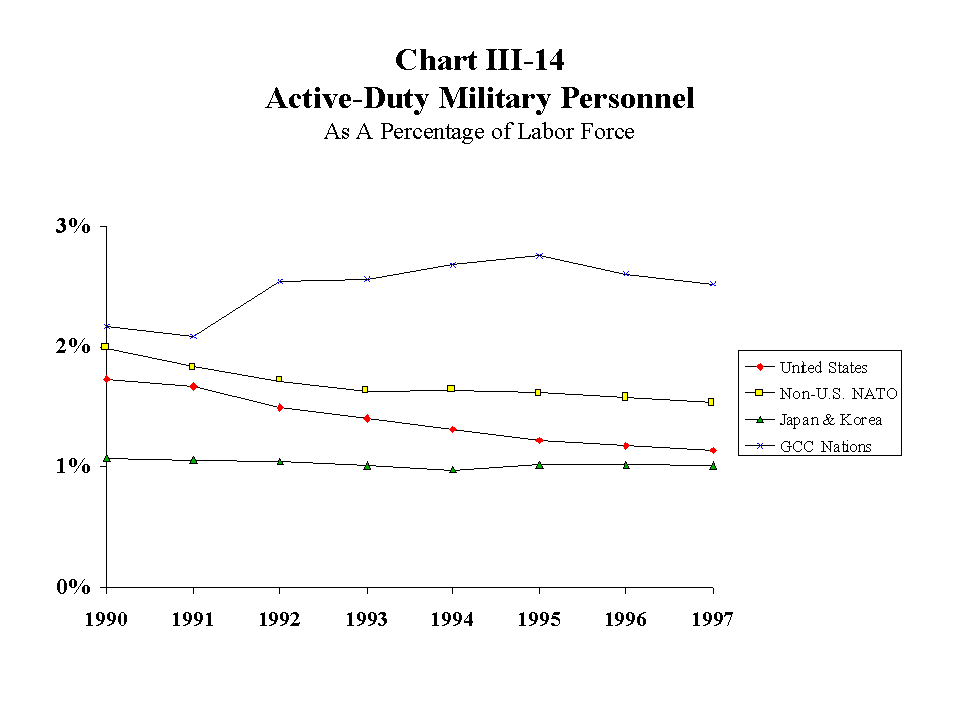
Military personnel is a fundamental defense resource that a nation can contribute to shared security objectives. For the purposes of this Report, military personnel contributions are measured using active–duty troop levels, and a nation’s ability to contribute is determined by the size of its labor force.
Chart III–14 shows active–duty military as a percentage of labor force from 1990 to 1997. During this period, the U.S. ratio has experienced a slow but steady decline, while the decrease in this percentage among our NATO allies appears to have leveled off since 1993. On the other hand, following the Gulf War the GCC countries as a group have achieved a notable increase in this ratio. Japan and the Republic of Korea combined have the lowest share of labor force on active–duty (1 percent), a level that has remained fairly constant during this period.
Chart III–14
Active Duty Military Personnel As A Percentage of Labor Force
(view full–size chart)
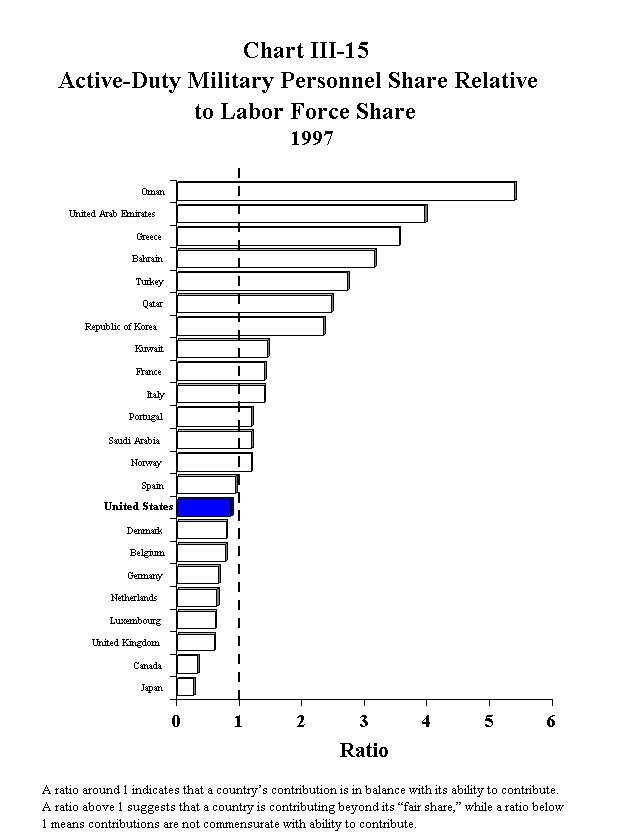
Chart III–15 compares all the countries in the Report in terms of active–duty military share relative to labor force share for 1997. The chart shows that Oman makes the largest contribution of military personnel relative to ability to contribute, followed by the United Arab Emirates, Greece, Bahrain, Turkey, Qatar, and the Republic of Korea. These countries, along with Kuwait, France, Italy, Portugal, Saudi Arabia, and Norway, each contribute a share of active–duty military personnel significantly (at least 20 percent) greater than their share of total labor force.
Chart III–15
Active Duty Military Personnel Shate Relative to Labor Force Share 1997
(view full–size chart)
Congress has not identified a specific responsibility sharing target for military personnel. However, on the basis of the foregoing analysis, the Department assesses that the thirteen nations identified in the preceding paragraph are making substantial responsibility sharing contributions in this category. This assessment is summarized in Chart I–2.
Note that this analysis would yield different results if reservists and defense civilians were included, based on variations in national policies for personnel utilization. For instance, the ranking of nations that place a greater reliance on mobilizable forces—such as Norway—would improve relative to nations like Canada which have a preponderance of active–duty forces. An expanded analysis of this type is beyond the scope of this Report, however, due to a lack of complete, comparable, and unclassified data on reservists and defense civilians.
There is no single, comprehensive indicator that reflects all of the factors that determine military capability. The material in this section is intended to provide an overview of each country’s force contributions using a few widely accepted measures.
Although Congress did not define specific responsibility sharing targets for military forces in general, the Department believes they represent an important contribution to shared security objectives. Country efforts in this area are assessed consistent with previous reports, and summarized in Chart I–2.
Ground Combat Capability
Nations’ ground combat capabilities are measured according to the quantity and quality of their major weapon systems, drawing on static indicators that have been widely used within DoD and NATO. This approach provides more insight into combat potential than do simple counts of combat units and weapons, although it does not consider such factors as ammunition stocks, logistical support, communications, training, leadership, and morale. At this time there is no generally accepted static measure of ground combat capability that incorporates these factors.
The largest contributors to aggregate ground capability are shown in Chart III–16. The United States provides by far the largest share of ground combat capability of any nation in this Report, followed by Germany, the Republic of Korea, and Turkey. The U.S. share has increased modestly in recent years and now stands at 44 percent, due largely to the increased capability of modern U.S. weapon systems.
Chart III–16
Ground Combat Capability 1997
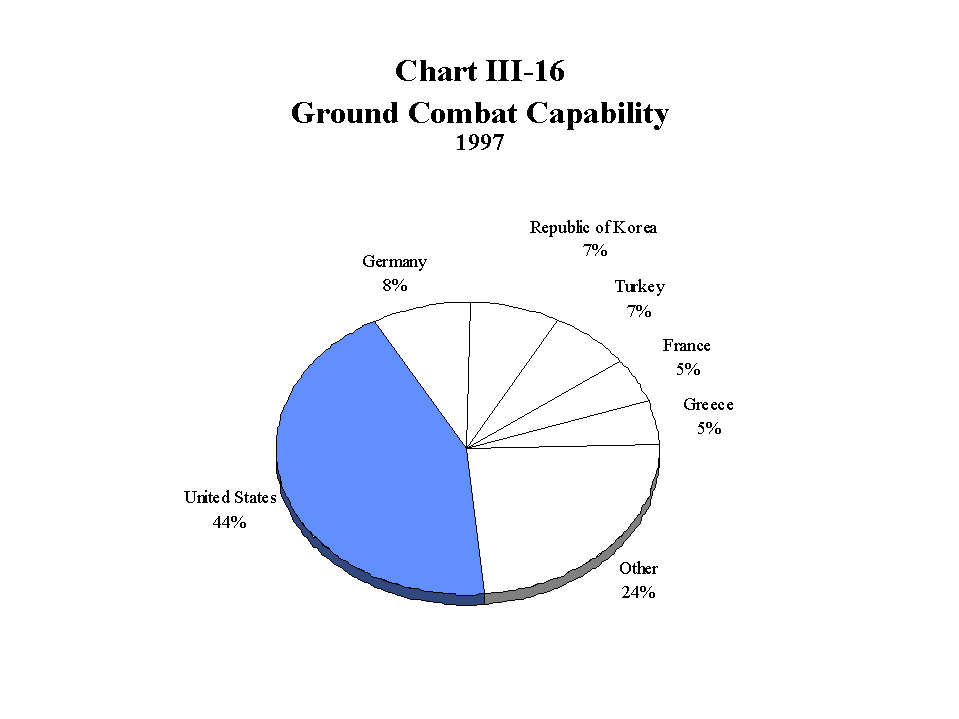
(view full–size chart)
Chart III–17 compares nations’ ground capability contributions with ability to contribute. In 1997, eleven countries contributed shares of ground combat capability significantly (at least 20 percent) greater than their share of total GDP. This includes all the GCC countries, led by Bahrain. Among NATO countries, Greece and Turkey make by far the largest contributions in this category. Other nations with significant ground combat capability relative to their ability to contribute are the Republic of Korea, the Netherlands, and Norway.
Chart III–17
Ground Combat Capability Share Relative to GDP Share 1997
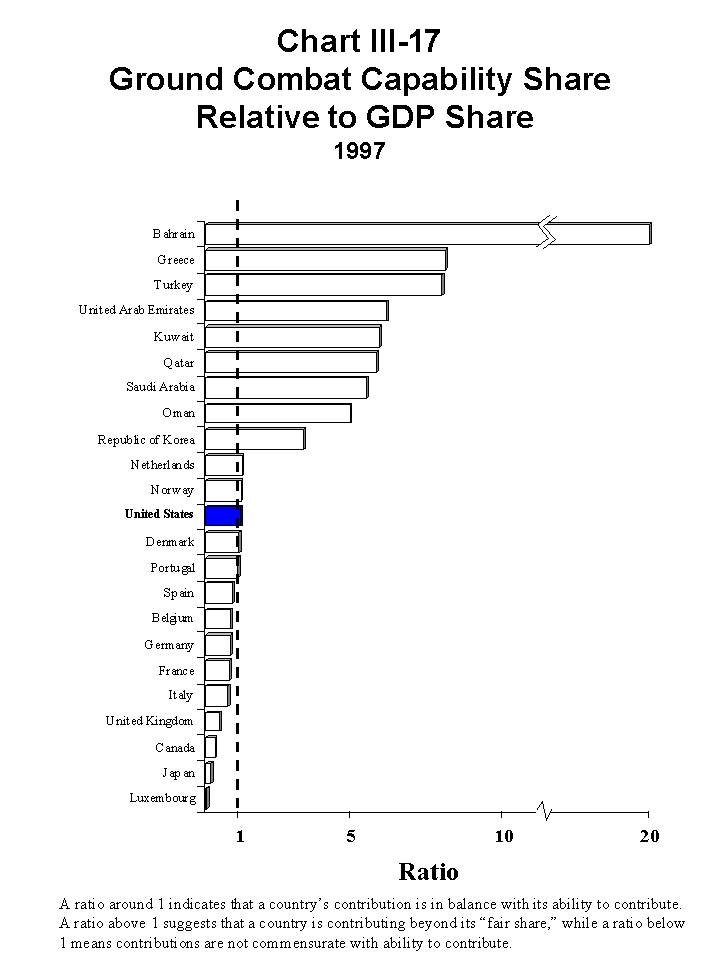
(view full–size chart)
On the basis of the analysis reflected in Chart III–17, the Department assesses that these eleven nations (identified above) are making substantial responsibility sharing contributions in the area of ground combat capability.
Naval Force Tonnage
Tonnage is a static measure of aggregate fleet size that provides a more meaningful basis for comparison than do simple tallies of ships. The use of tonnage alone as an indicator does not, however, provide any indication of the number of weapons aboard ships, or of the weapons’ effectiveness or reliability. Also, this measure does not assess the less tangible ingredients of combat effectiveness, such as training and morale. Consequently, tonnage data should be considered only a rough indicator of naval potential.
Chart III–18 shows the nations with the largest shares of aggregate fleet tonnage (excluding ballistic submarines). Note that the U.S. fleet includes some types of vessels not generally found in most allied navies (e.g., aircraft carriers, fleet support, sealift, and amphibious vessels). As a result, the United States has by far the single largest share of fleet tonnage with over 50% of the total tonnage of all countries in this Report combined. The next largest tonnage levels are those of the United Kingdom, Japan, and France.
Chart III–18
Naval Force Tonnage All Ships Less Strategic Submarines 1997
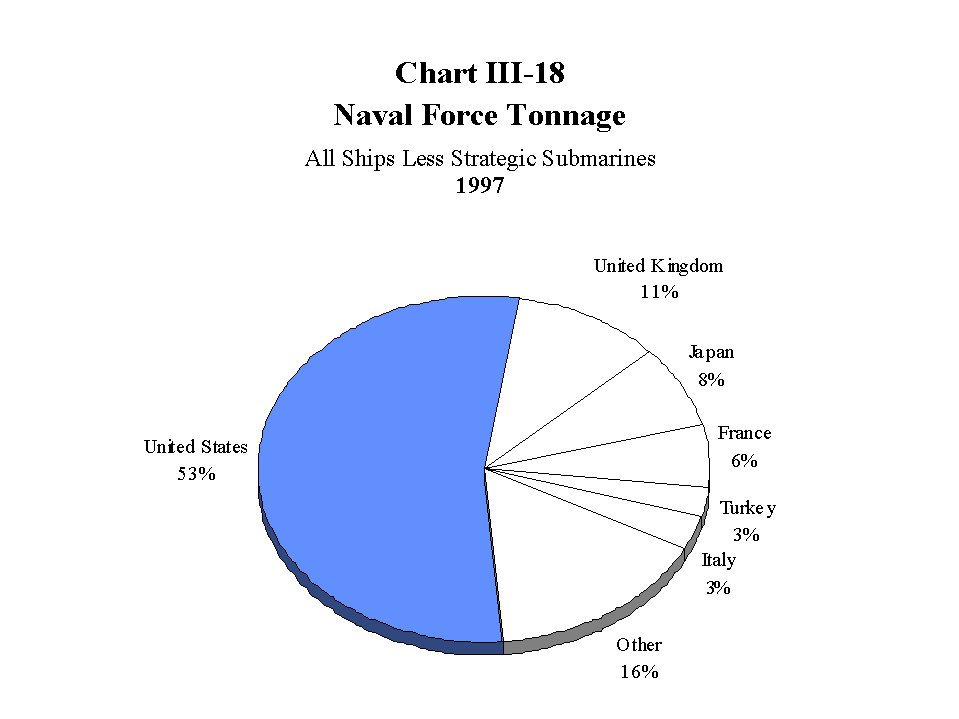
(view full–size chart)
Chart III–19 reflects national shares of total fleet tonnage relative to GDP shares. In 1997, seven countries had shares of naval force tonnage significantly (at least 20 percent) greater than their share of GDP, led by Oman, and including Greece, Turkey, Bahrain, the United Kingdom, Portugal, and the United States. On the basis of this analysis, the Department assesses that these seven nations are making substantial responsibility sharing contributions in the area of naval tonnage.
Chart III–19
Naval Force Tonnage Share Relative to GDP Share All Ships Less Strategic Submarines 1997
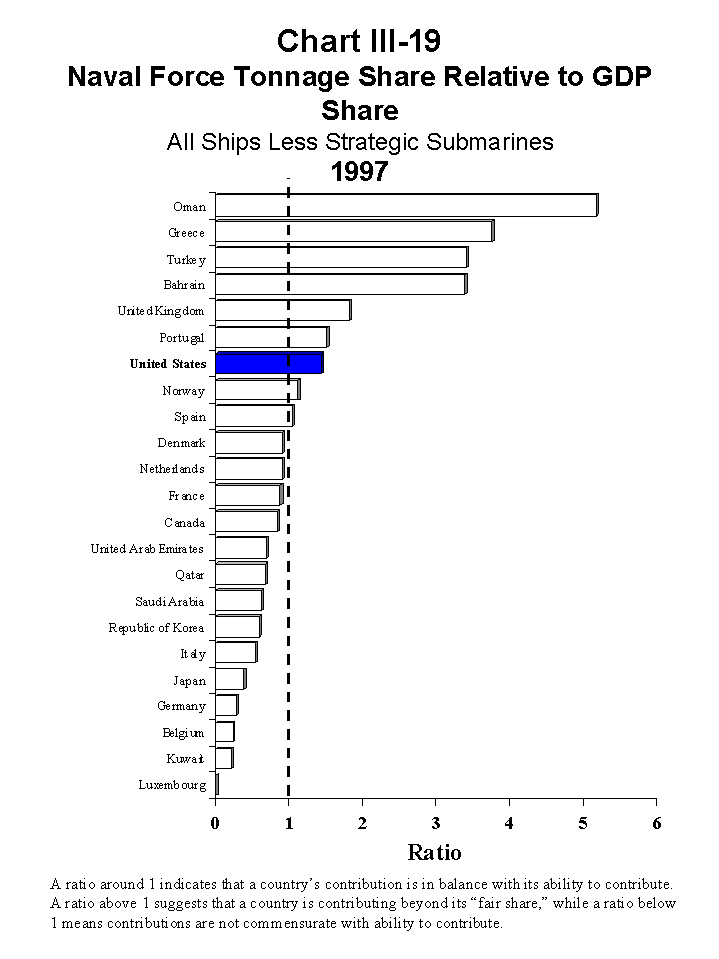
(view full–size chart)
Tactical Combat Aircraft
Aircraft tallies are the best available measure of the strength of nations’ air forces. As with the other force indicators discussed above, unit counts of aircraft do not measure combat effectiveness, or take into account factors such as differences in ammunition, training, or morale.
Chart III–20 depicts the distribution of tactical combat aircraft among nations addressed in this Report (including air force, naval, and marine assets). The United States possesses over one–third of all combat aircraft, followed by France and the United Kingdom.
Chart III–20K
Tactical Combat Aircraft 1997
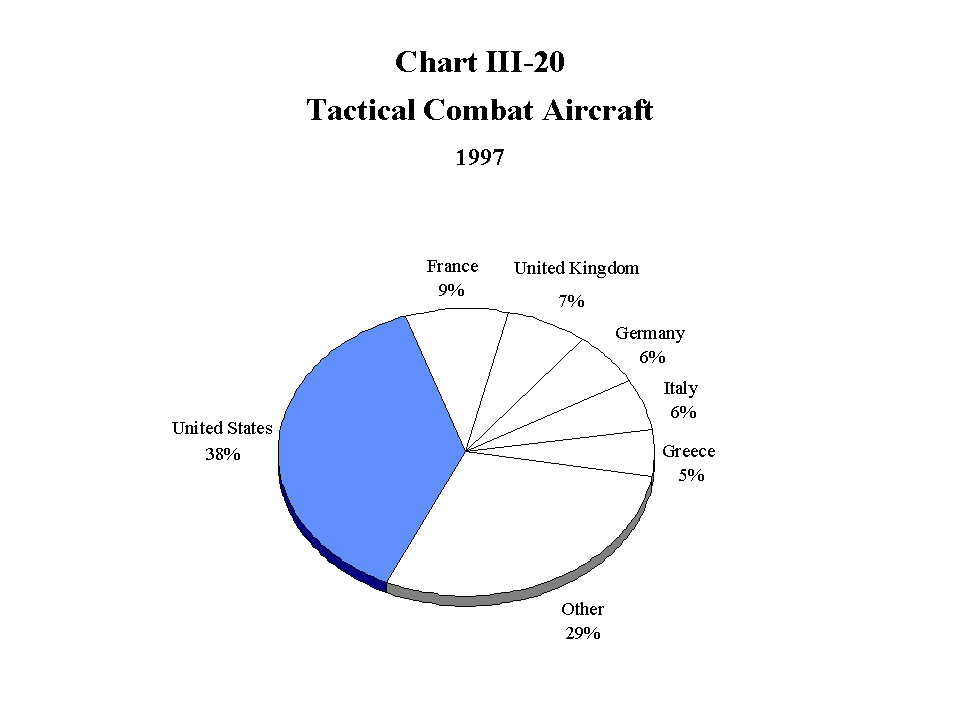
(view full–size chart)
Chart III–21 reflects national shares of the total combat aircraft inventory in relation to GDP shares. A majority of the countries in this Report have combat aircraft shares significantly (at least 20 percent) above their GDP share, led by Bahrain and including the other five GCC countries, along with Greece, Turkey, Portugal, the Republic of Korea, Belgium, and France. On the basis of this analysis, the Department assesses that these twelve nations are making substantial responsibility sharing contributions in the area of tactical combat aircraft.
Chart III–21
Tactical Combat Aircraft Share Relative to GDP Share 1997
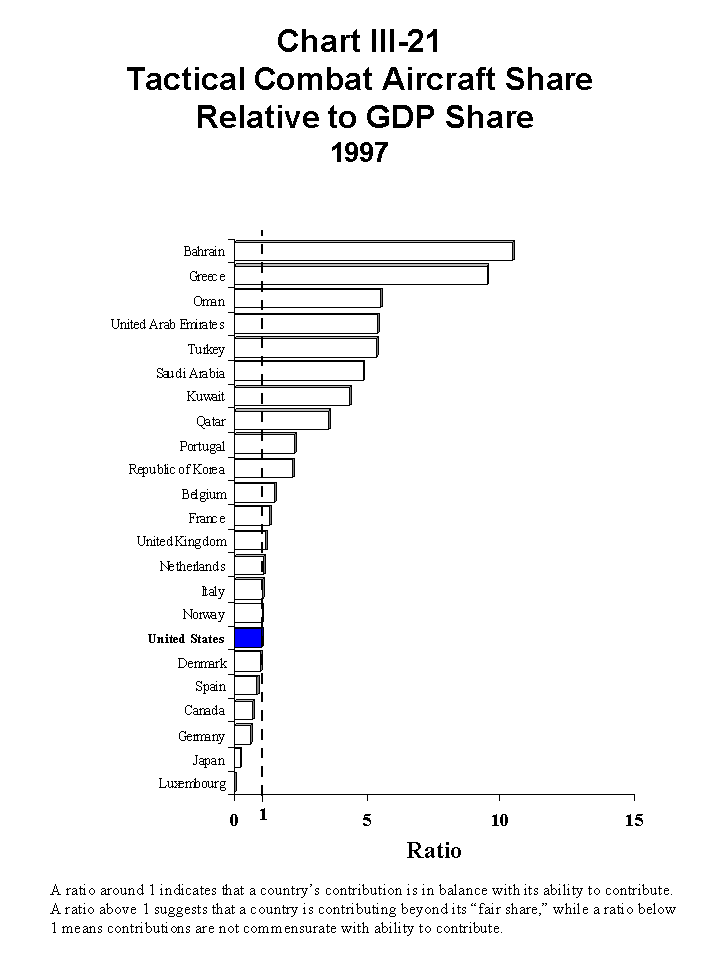
(view full–size chart)
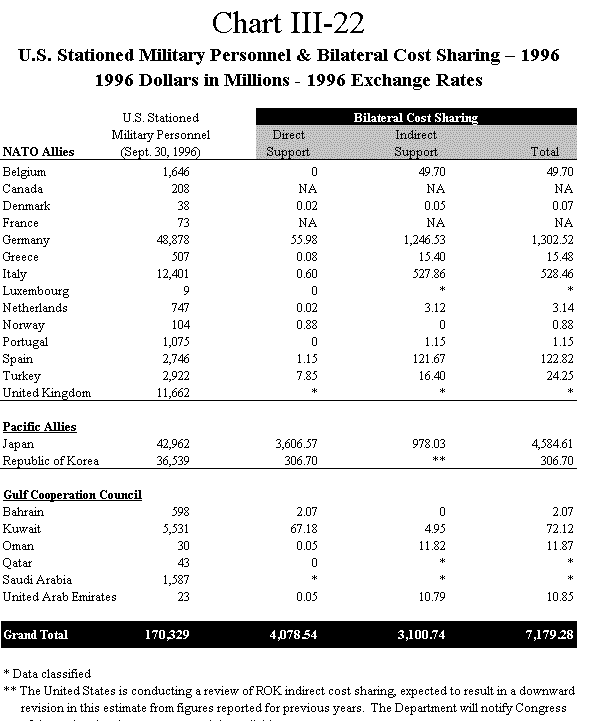
The most familiar form of cost sharing is bilateral cost sharing between the United States and an ally or partner nation that either hosts U.S. troops and/or prepositioned equipment, or plans to do so in time of crisis. The Department of Defense distinguishes between two different types of bilateral cost sharing: the direct payment of certain U.S. stationing costs by the host nation (i.e., on–budget host country expenditures), and indirect cost deferrals or waivers of taxes, fees, rents, and other charges (i.e., off–budget, foregone revenues).
Cost Sharing Contributions
As shown in Chart III–22, the Department estimates that in 1996 (the most recent year for which data are available) the United States received direct and indirect cost sharing assistance from our NATO, Pacific, and GCC allies totaling $7.2 billion.
Cost sharing has been a particularly prominent aspect of our bilateral defense relationships with Japan (since the late 1970s) and the Republic of Korea (since the late 1980s). The current Asian financial crisis may affect bilateral cost sharing levels in 1998, especially for the Republic of Korea due to the amount of ROK cost sharing transacted in U.S. dollars.
As Chart III–22 shows, Japan provides a greater level of direct cost sharing than we receive from any other ally. This is due largely to the strict constitutional limits that apply to the Japanese armed forces, and concerns for regional stability shared by the United States, Japan, and its Asian neighbors. Refer to the previous chapter for additional details on Japanese cost sharing.
The Republic of Korea first agreed to contribute to a program for Combined Defense Improvement Projects (CDIP) construction in 1979—which marked the beginning of our present cost sharing relationship. In 1988, the Republic of Korea agreed to a CDIP program funded initially at $40 million a year. Since that time, annual cost sharing negotiations have brought a gradual increase in ROK cost sharing. During 1996, the ROK provided over $300 million in direct cost sharing. Estimates of indirect ROK cost sharing for 1996 are unavailable due to a reevaluation of measurement methodology, expected to be complete by the time 1997 cost sharing estimates are compiled later this spring. Further information on U.S.–ROK cost sharing is included in Chapter II.
NATO countries have long provided substantial indirect support for U.S. forces stationed on their territory. Our allies provide rent–free bases and facilities, various tax exemptions, and reduced–cost services. Among allies with the largest cost sharing contributions to the United States in 1996 were Germany ($1.30 billion), Italy ($528 million), Spain ($123 million), and Belgium ($50 million). In addition, Norway has agreed to pay roughly $5 million (50 percent) of the cost of maintaining prepositioned U.S. Marine equipment.
Chart III–22
U.S. Stationed Military Personnel & Bilateral Cost Sharing—1996 1996 Dollars in Millions—1996 Exchange Rates
(view full–size chart)
In addition to bilateral cost sharing, our NATO allies also provide multilateral cost sharing, through common– and jointly–funded budgets. These include the NATO Security Investment Program (NSIP); the NATO Military Budget for the operations and maintenance (O&M) of NATO Military Headquarters, agencies, and common–use facilities; and the NATO Civil Budget for O&M of the NATO Headquarters and several non–military programs including civil preparedness. See Chart III–24 at the conclusion of this section for additional detail.
Several recent developments in collective NATO cost sharing are quite favorable to the United States, including NSIP funding for certain projects in support of U.S. forces that would not normally be NSIP–eligible (e.g., quality of life facilities at Aviano Air Base, Italy). In addition, the United States stands to gain direct savings from NATO’s Collective Cost Sharing initiative, under which the Alliance will offset U.S. O&M costs for prepositioned war reserve equipment and material. Finally, U.S. savings of $1 million or more will be realized due to increased participation by France and Spain in NATO’s common– and jointly–funded budgets. On the other hand, NATO enlargement will place increased demands on common funds, and will require greater national contributions (including contributions from new NATO members and increased contributions from current members) in the period following accession.
With respect to our security partners in Southwest Asia, bilateral cost sharing in 1996 included $148 million paid or pledged by Kuwait, Saudi Arabia, Oman, United Arab Emirates, Qatar, and Bahrain to offset U.S. incremental costs in the Persian Gulf region. Saudi Arabia likewise provided substantial cash and in–kind contributions to offset the costs of U.S. military operations in Southwest Asia, including Operation Southern Watch. Kuwait and Qatar both host a prepositioned U.S. Army heavy brigade equipment set, and share the land use, maintenance, and operating costs for U.S. forces stationed or exercising on their territory.
Assessment of Cost Sharing Contributions
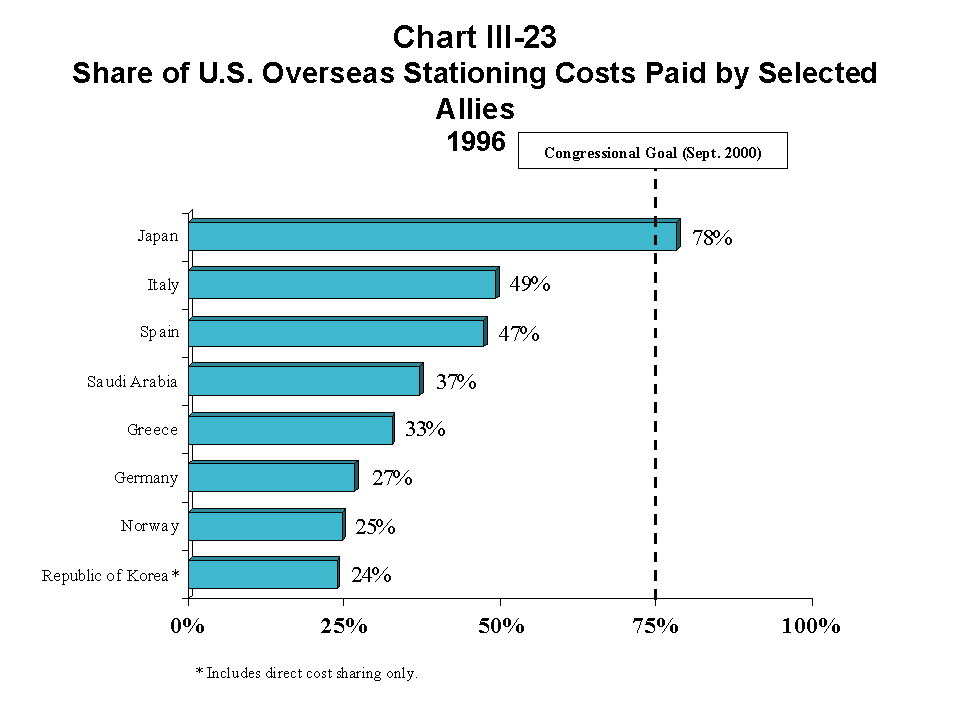
One of the objectives Congress established in the FY 1998 Defense Authorization Act was for nations that host U.S. forces to offset 75 percent of U.S. stationing costs by September 2000 through an increase in financial contributions, or the elimination of taxes, fees, or other charges levied on U.S. military personnel, equipment, or facilities in that nation. Chart III–23 shows the nations with the greatest U.S. cost offset percentages for 1996. Note: Cost offset percentages cannot be calculated for the GCC nations (with the exception of Saudi Arabia) due to the lack of information regarding U.S. stationing costs in those countries.
The Defense Authorization Act for FY 1997 and FY 1998 endorse the Department’s view that cost sharing is but one aspect among several in assessing allies’ efforts. Cost sharing objectives are not appropriate for all countries, due to the differences in the objectives of our security relationships with various allies and partners. For instance, there is no tradition in Europe of providing the kind of direct cash and in–kind support provided, by Japan and the Republic of Korea, since the emphasis in NATO for many years has been on strengthening participation in the military roles and missions of the Alliance. In contrast, due to the much different security situation in the Pacific and the unique defense capabilities of Japan and the Republic of Korea, our responsibility sharing policy in this region has emphasized cost sharing rather than global military roles and missions.
Currently Japan is the only country to meet the Congressional cost sharing target. Over the next few years we expect the Japanese cost share percentage to remain around the 75 percent level due to the multi–year SMA signed with Tokyo in 1995.
In addition to measuring cost sharing contributions according to the proportion of U.S. costs that are offset, host nation support can also be evaluated relative to a country’s ability to incur cost sharing obligations. Using this approach, the countries with shares of bilateral host nation support contributions to the United States substantially (at least 20 percent) greater than their share of GDP are Kuwait, followed by Japan, Qatar, Oman, and Luxembourg. The Republic of Korea is excluded from this list due to measurement problems surrounding estimates of ROK’s indirect cost sharing contributions for 1996, but is expected to rejoin this ranking once cost sharing estimates for 1997 are compiled later this spring.
These assessments are summarized in Chart I–1 and Chart I–2.
Chart III–23
Share of U.S. Overseas Stationing Costs Paid By Selected Allies 1996
(view full–size chart)
Multilateral Cost Sharing: NATO’s Common–Funded Budgets
NATO’s long–standing arrangement to share costs of mutually–beneficial projects is one of the Alliance’s oldest and truest tools to promote responsibility sharing equity. A summary of 1997 outlays by each of the NATO common–funded budgets is provided below, showing each country’s contribution and percentage share of costs incurred.
Chart III–24
NATO’s Common–Funded Budgets—1997 1997 Dollars in Millions—1997 Exchange Rates
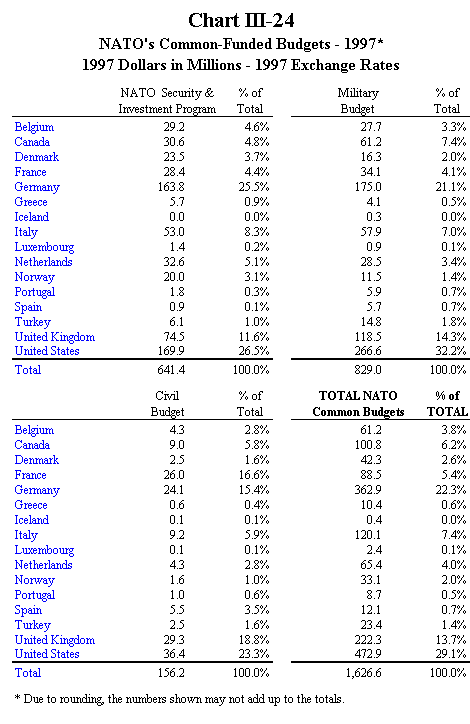
(view full–size chart)
Foreign assistance plays a prominent role in nations’ overall responsibility sharing efforts. Although economic aid does not directly increase U.S. and allied defense capabilities, it makes an important contribution to global peace and stability. Most industrialized NATO countries and Japan have for many years extended various types of assistance to developing countries. In addition, and of special significance in the post–Cold War era, NATO nations, Japan, and the Republic of Korea also provide important assistance to the emerging democracies in Central Europe and the New Independent States (NIS) of the former Soviet Union.
Foreign Assistance Contributions
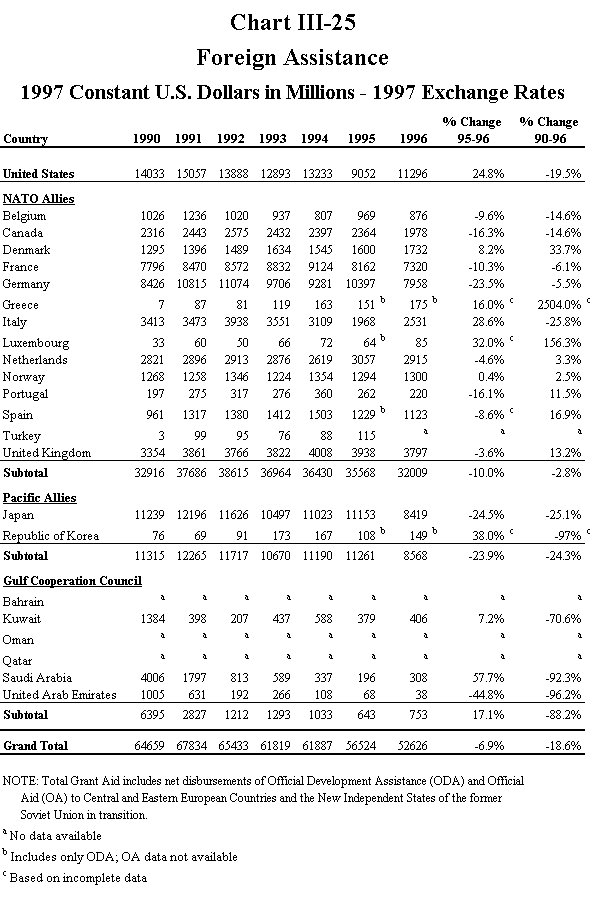
As shown in Chart III–25, disbursements of foreign assistance by nations included in this Report exceeded $52 billion in 1996 (the latest year for which reliable data are substantially complete). Of this sum, over $41 billion was provided by our allies and partners. This aid reflects a commitment to promote democratization, economic stabilization, transparency arrangements, defense economic conversion, and respect for the rule of law and internationally–recognized human rights. The OECD reports, however, that foreign aid for 1996 represented only 0.25 percent of the combined GDPs of the nations in this Report, the lowest level in nearly 30 years.
Chart III–25 also shows that, as in the recent past, the four nations with the largest foreign assistance contributions (in absolute terms) in 1996 were the United States, Japan, Germany, and France. At the other end of the spectrum are those nations that contribute very modest amounts of foreign aid, although this may be justified in the case of countries with relatively low standards of living (e.g., Turkey, the Republic of Korea, Greece, and Portugal).
Care must be exercised in evaluating year–to–year changes in foreign aid data. First, foreign aid flows can be somewhat volatile. The large percentage increase in foreign assistance provided by Saudi Arabia in 1996, for example, offsets the similarly large decrease experienced the previous year. Second, irregularities in the timing of disbursements may affect year–to–year comparisons. For example, OECD reports that some of the contributions that Italy and the United States planned to make in 1995 were not disbursed until 1996, creating an artificially large increase for both countries in 1996. Lastly, time lags in collecting complete data on nations’ foreign aid programs make it difficult to report full information on all countries. Thus, the apparent increase in Luxembourg’s foreign aid for 1996 is explained in part by the continuing lack of certain data on their contributions for 1995.
Based on the available data, almost as many nations achieved real growth in foreign aid in 1996 from the prior year as made reductions in their aid programs. Bearing in mind the above cautions, the largest percentage change in 1996 over 1995 levels were reported for Saudi Arabia (58 percent), the Republic of Korea (38 percent), Luxembourg (32 percent), Italy (29 percent), the United States (25 percent), and Greece (16 percent). Sharpest reductions were reported for the United Arab Emirates (–45 percent), Japan (–25 percent), Germany (–23 percent), Portugal (–16 percent), Canada (–16 percent), Belgium (–10 percent), France (–10 percent), and Spain (–9 percent). For all nations combined, foreign aid declined roughly 7 percent from 1995 to 1996.
Chart III–25
Foreign Assistance 1997 Constant U.S. Dollars in Millions—1997 Exchange Rates
(view full–size chart)
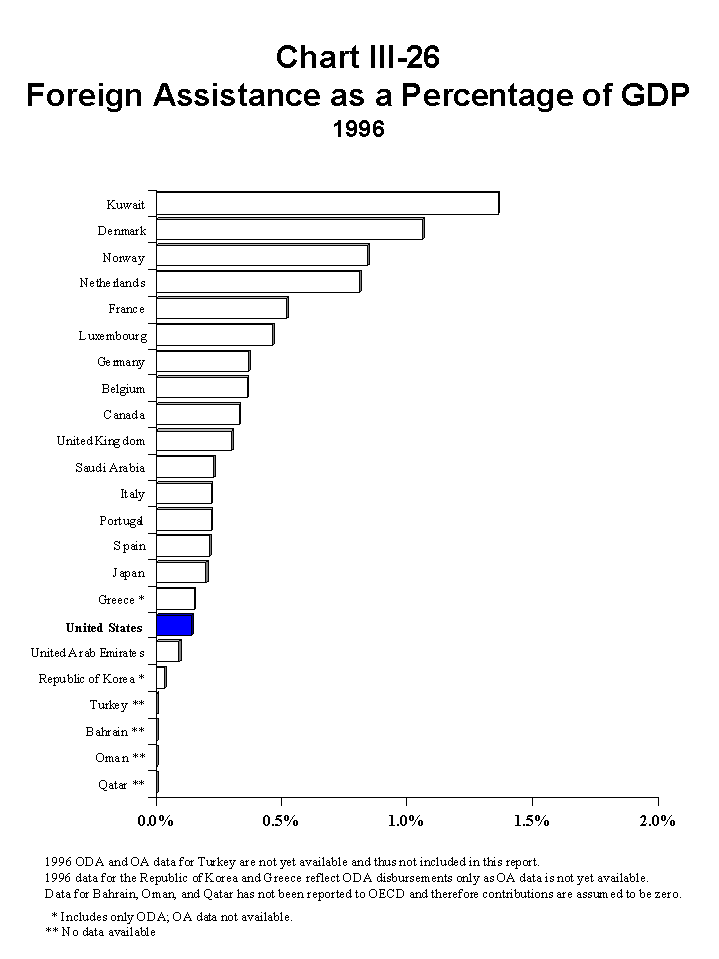
To improve the comparability of foreign assistance contributions among nations, Chart III–26 depicts each nation’s foreign assistance contributions relative to its GDP for 1996. From this perspective, the largest grant aid donors are Kuwait, Denmark, Norway, and the Netherlands (the only nations to meet or surpass UN assistance targets of 0.7 percent of GDP). Among nations for which complete data are available, the United States ranks as the second lowest of all donor nations assessed in this Report, ahead of only the United Arab Emirates.
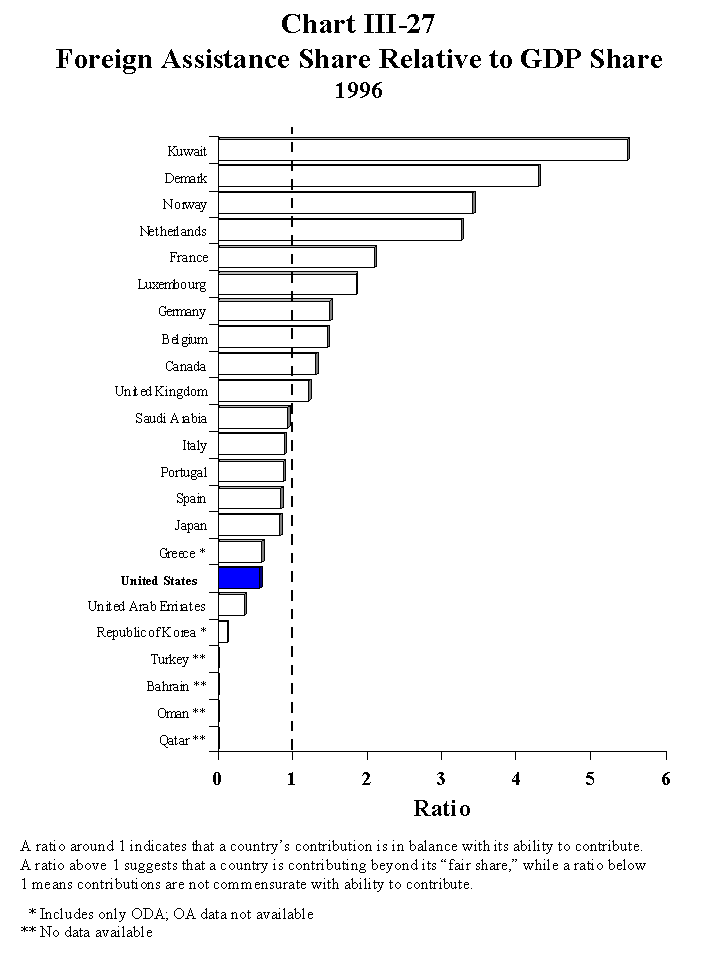
Chart III–27 depicts the same information as the previous graph, but helps address the question of equity by relating nations’ share of contributions to their share of GDP. This approach indicates that ten countries addressed in this Report provided foreign assistance shares significantly (at least 20 percent) greater than their share of GDP—in addition to the four countries identified above, this includes France, Luxembourg, Germany, Belgium, Canada, and the United Kingdom.
|
Chart III–26
Foreign Assistance as a Percentage of GDP 1996 |
Chart III–27
Foreign Assistance Share Relative to GDP Share 1996 |
Assessment of Foreign Assistance Contributions
In the FY 1998 Defense Authorization Act, Congress established two targets for our allies in the area of foreign assistance: increase foreign assistance by 10 percent compared to the preceding year, or achieve a level of foreign assistance at least commensurate with that of the United States. With the exception of the United Arab Emirates (and Turkey, Bahrain, Oman, and Qatar, for which data are not available), every country addressed in this Report met one or both of these targets in 1996.
Specifically, allies or partners with reported increases of 10 percent or more in foreign aid contributions included Saudi Arabia (58 percent), the Republic of Korea (38 percent), Luxembourg (32 percent), Italy (29 percent), and Greece (16 percent). (Note that these figures may be misleading in light of the anomalies discussed above.) In addition, based on ability to contribute, all of our allies and partners for which we have complete data—with the exception of the United Arab Emirates—made foreign assistance contributions at least commensurate with those of the United States.
As with other responsibility sharing indicators discussed elsewhere in this Report, the Department believes it is important to evaluate country efforts relative to their GDP share. Using this approach, ten nations achieved foreign aid shares substantially (at least 20 percent) greater than their GDP share: Kuwait, Denmark, Norway, the Netherlands, France, Luxembourg, Germany, Belgium, Canada, and the United Kingdom. Note that this is a more restrictive assessment than results from applying the Congressional targets—due to the fact that some countries satisfy the Congressional goals either due to anomalies in year–to–year reporting or due to the relatively low ranking of the United States.
These assessments are summarized in Chart I–1 and Chart I–2.
Every nation addressed in this Report satisfies at least one of the responsibility sharing targets established in the FY 1998 Defense Authorization Act, and most satisfy more than one. The same is true using the Department’s approach of assessing their contributions in relation to ability to contribute, although from this perspective several key differences emerge. These results are summarized in Chart I–1 and Chart I–2 presented in Chapter I.
We believe that this overall picture is positive, but we are committed to continued efforts to convince our allies and partners to achieve and maintain adequate defense budgets, and increase their contributions to multinational military activities. At the same time we will continue to emphasize the importance of increased host nation support and the critical role of foreign assistance in enhancing our collective security.
Finally, the FY 1998 Defense Authorization Act asks for a comparison of nations’ responsibility sharing contributions, specifically between February 28, 1997 and February 28, 1998. As explained in the Annex, the timing of data collection and analysis prevents the Department from reporting for those exact periods. Nevertheless, in response to the Congressional requirement, Chart III–28 provides a comparison for the two most recent years for which complete and reliable data are available. In providing this comparison, the Department wishes to reiterate that a balanced assessment of nations’ efforts requires a review of longer–term trends, including an evaluation of contributions relative to ability to contribute.
Chart III–28
Responsibility Sharing Indicators Comparisons of Last Two Years of Available Data
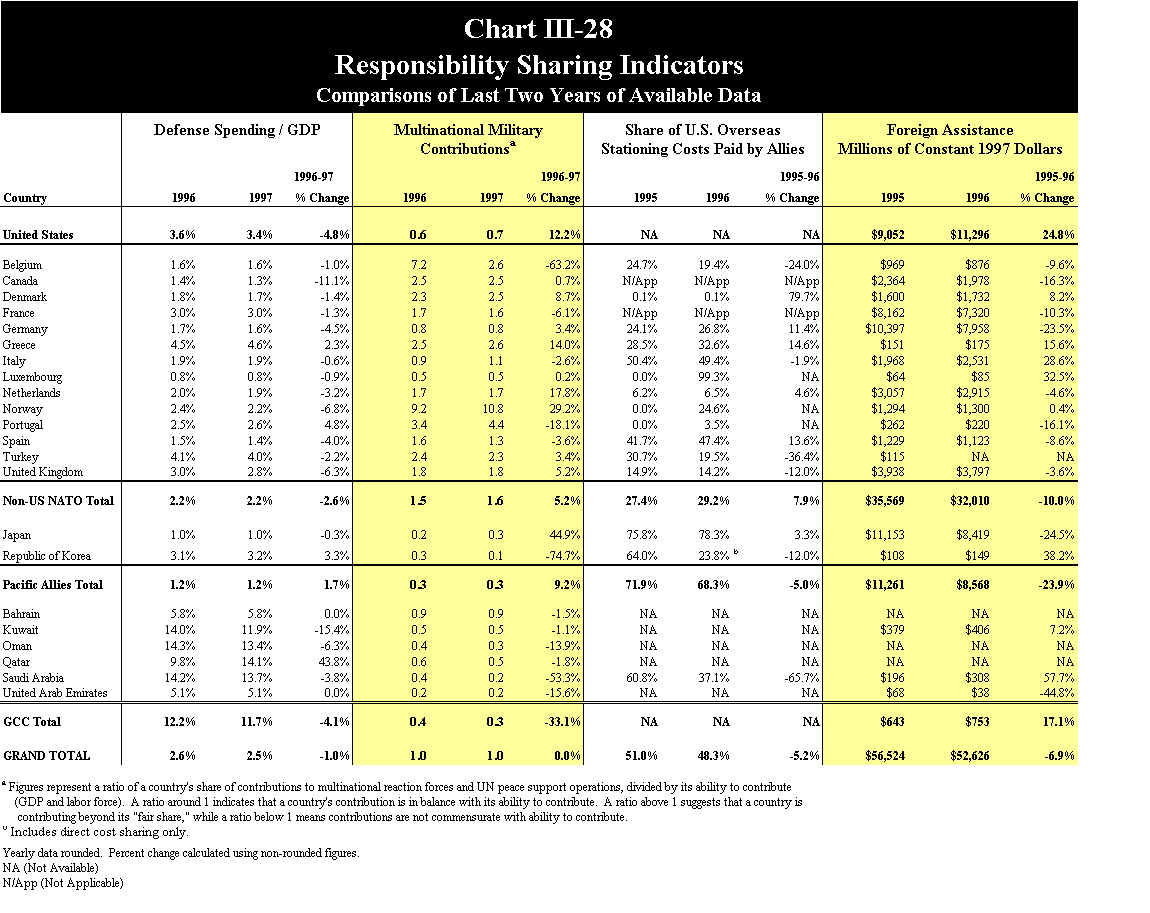
(view full–size chart)