|
|
|
|
Report on Allied Contributions to the Common Defense
A Report to the United States Congress by the Secretary of Defense
U.S. Department of Defense
March 1999
Annex: Data Notes, Country Summaries, and Additional Statistics
This Annex is organized into five sections, described below.
A. Data Notes. This section presents sources and notes pertaining to the data used in the Report and summarized in this Annex.
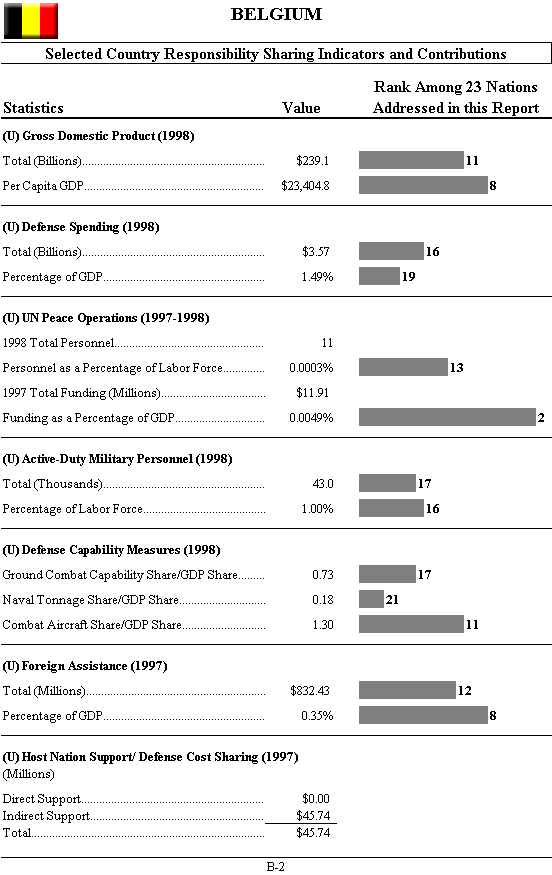
B. Country Summaries. This section provides summary information for responsibility sharing contributions on a country–by–country basis.
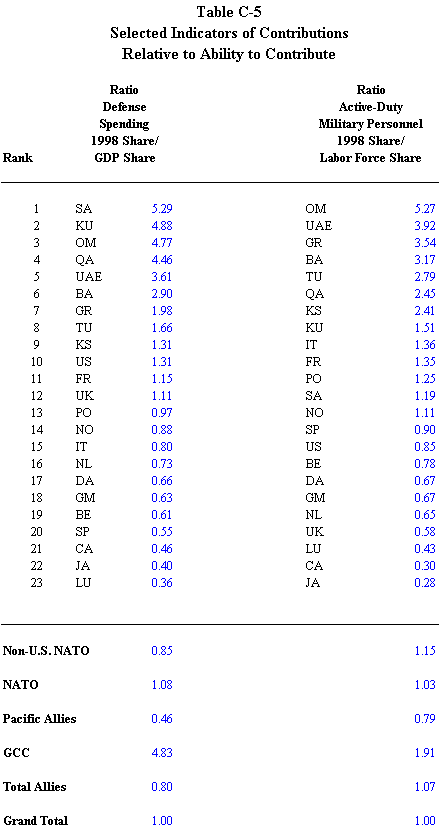
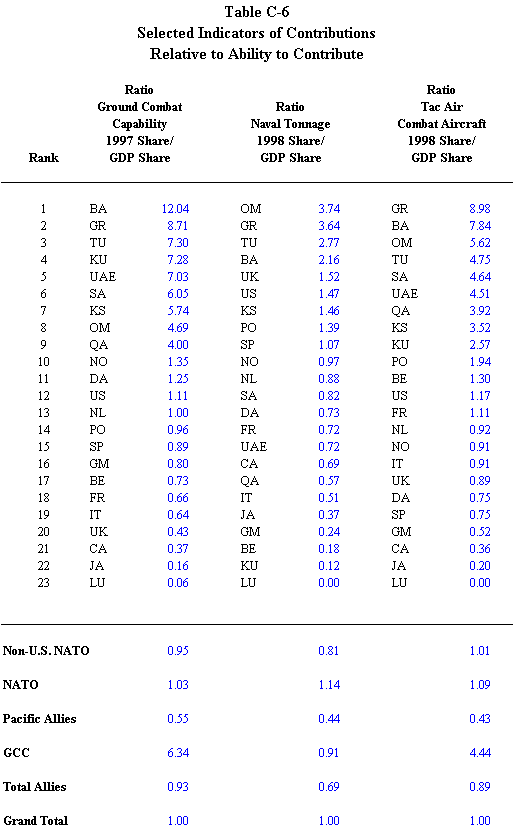
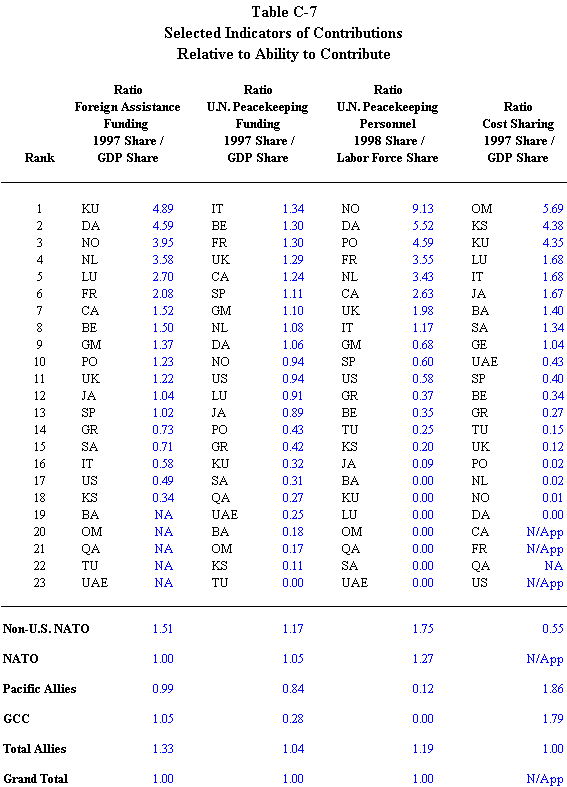
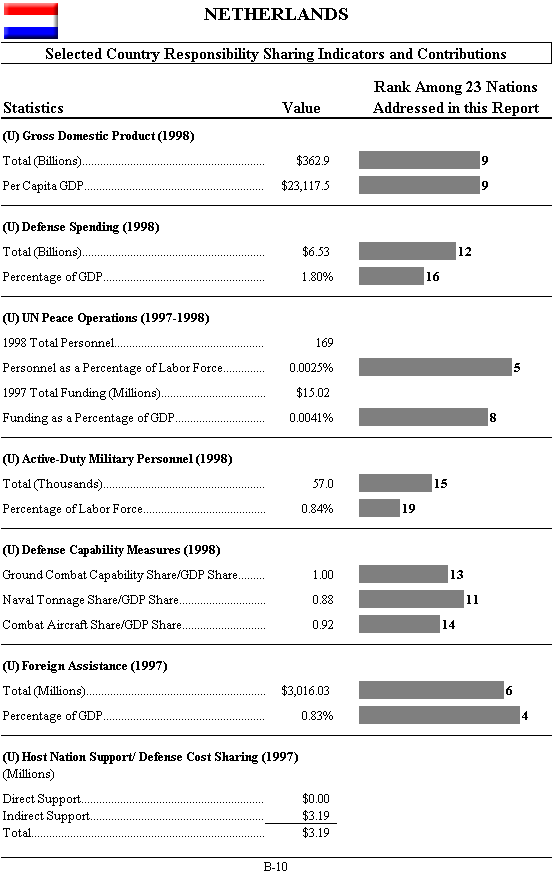
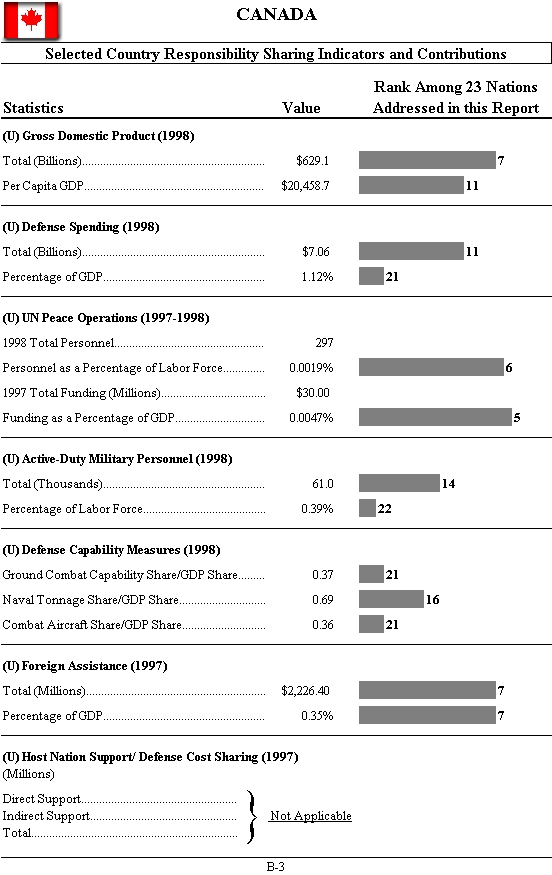
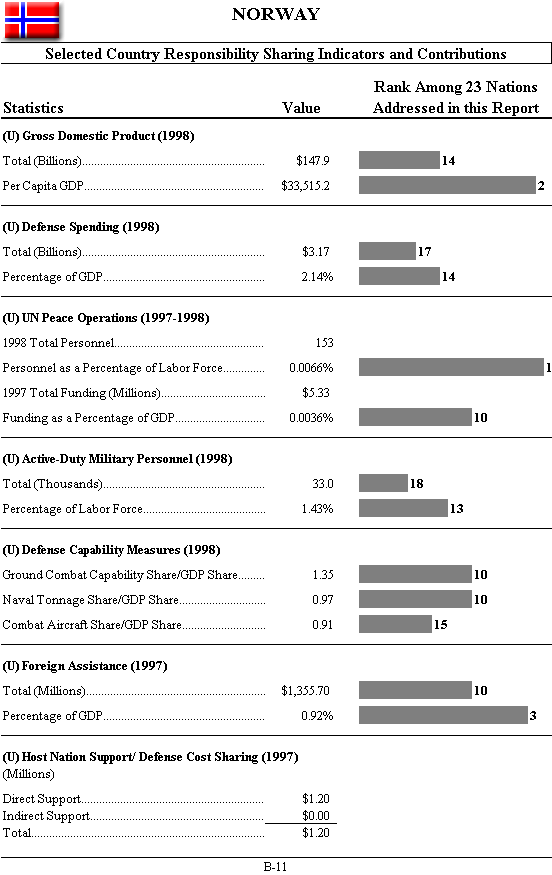
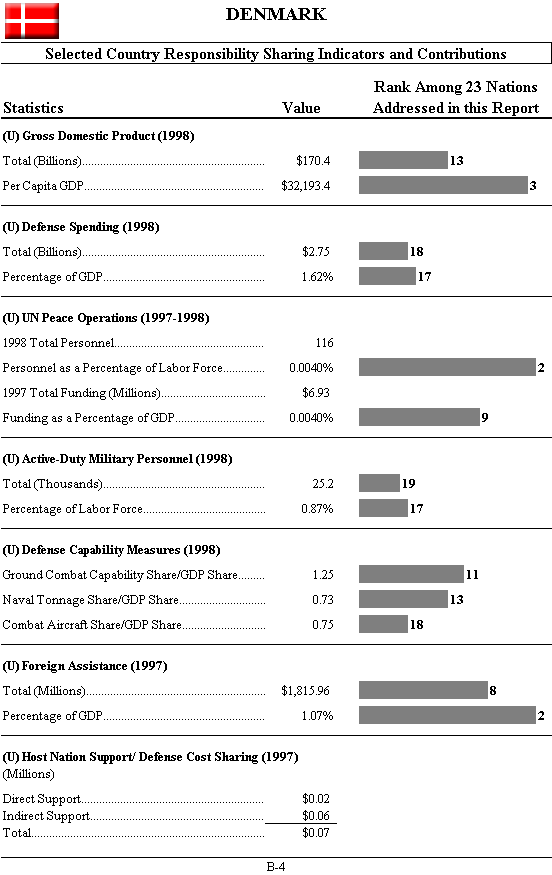
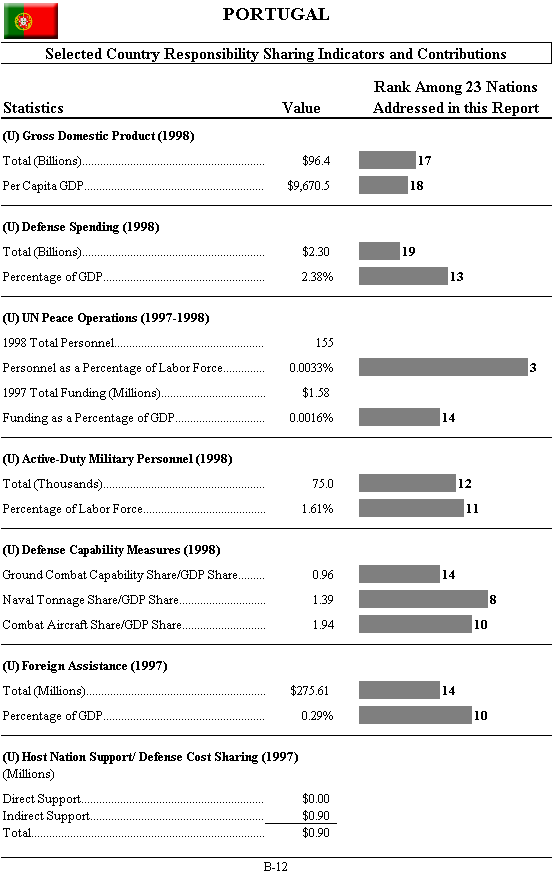
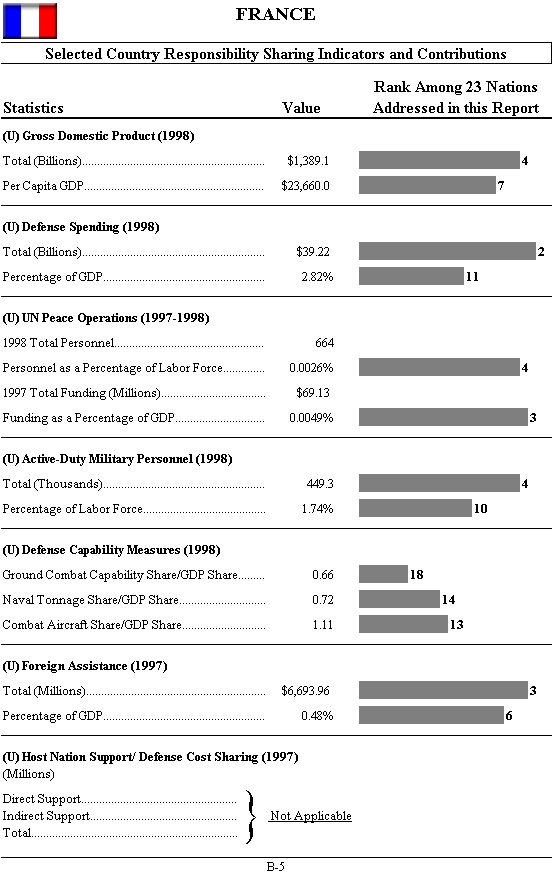
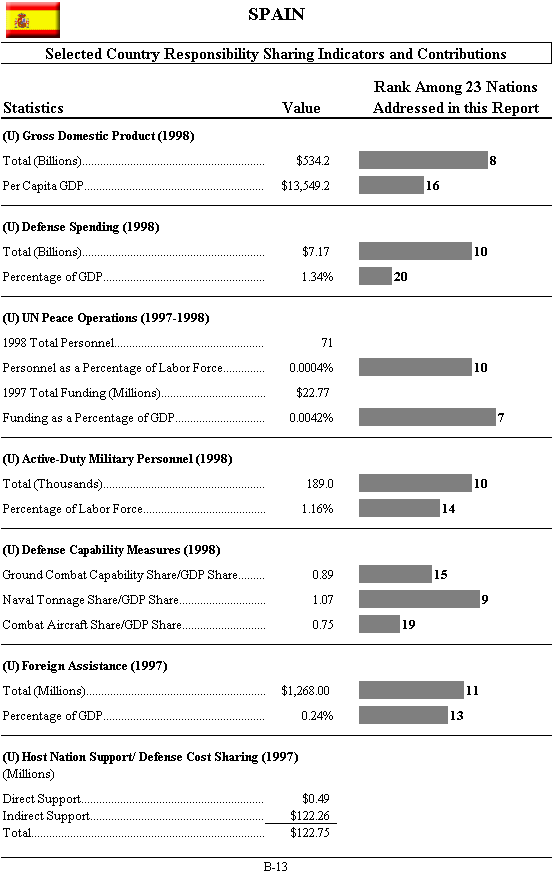
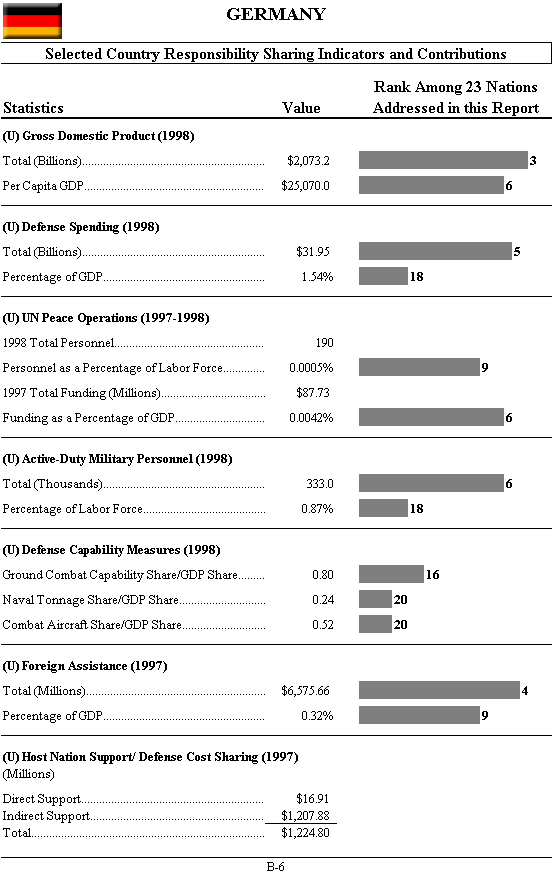
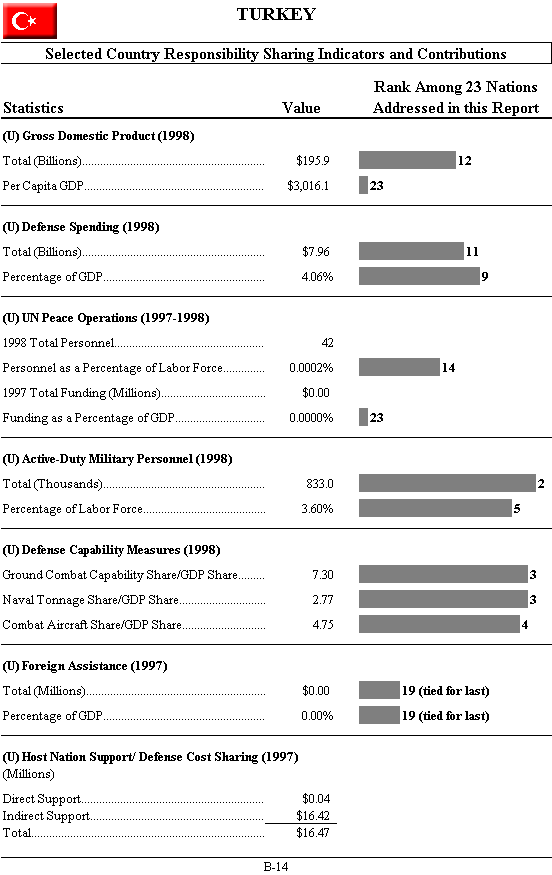
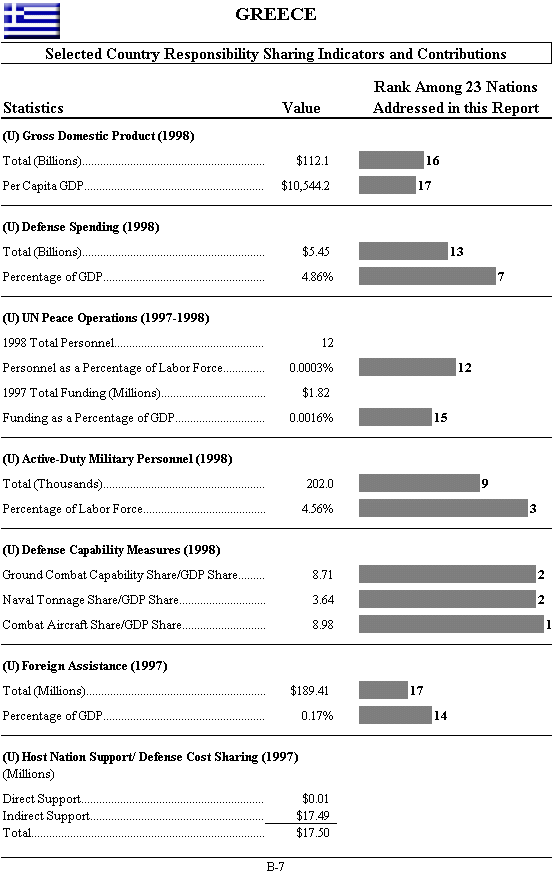
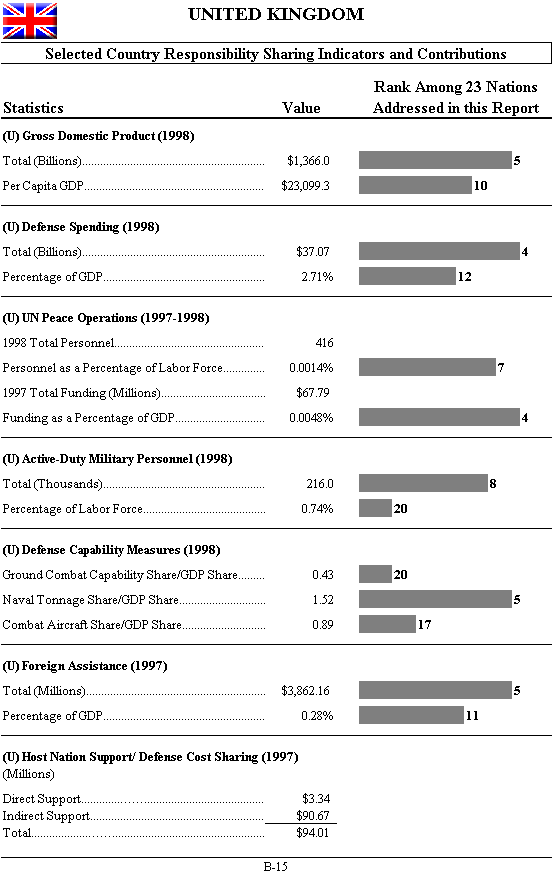
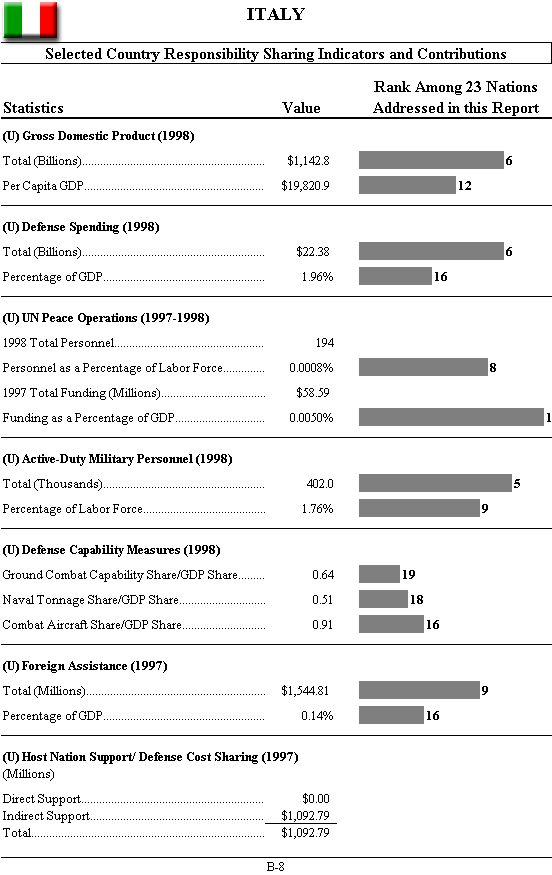
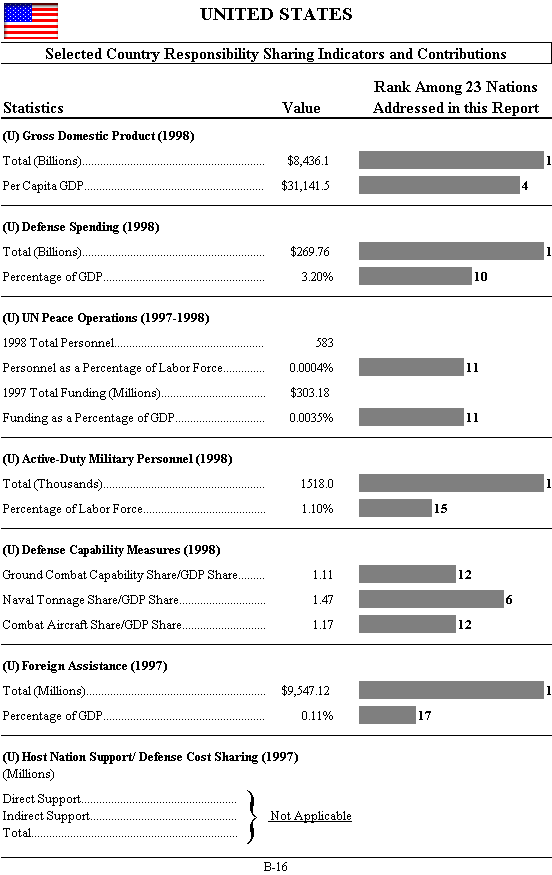
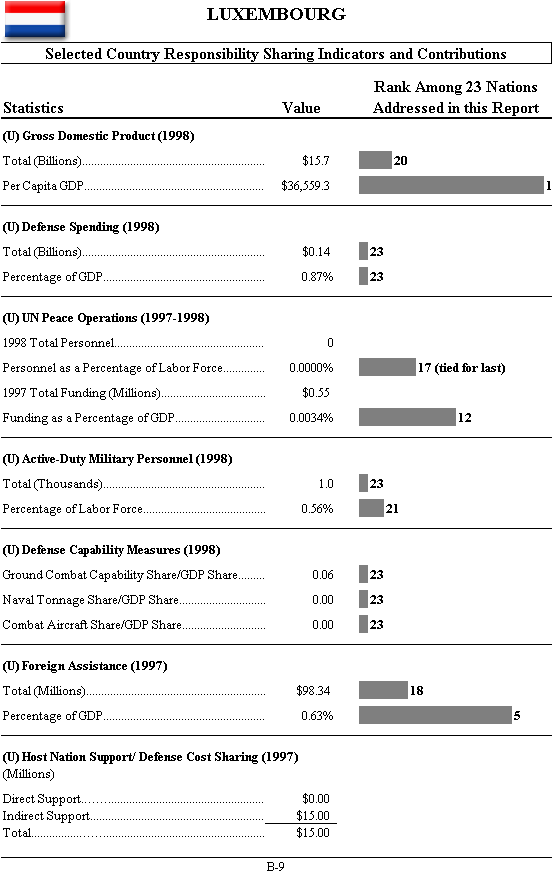
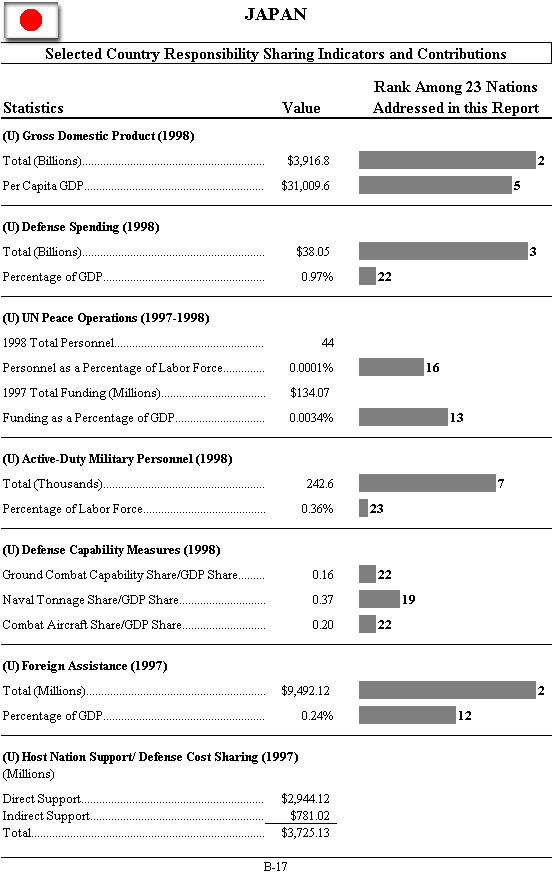
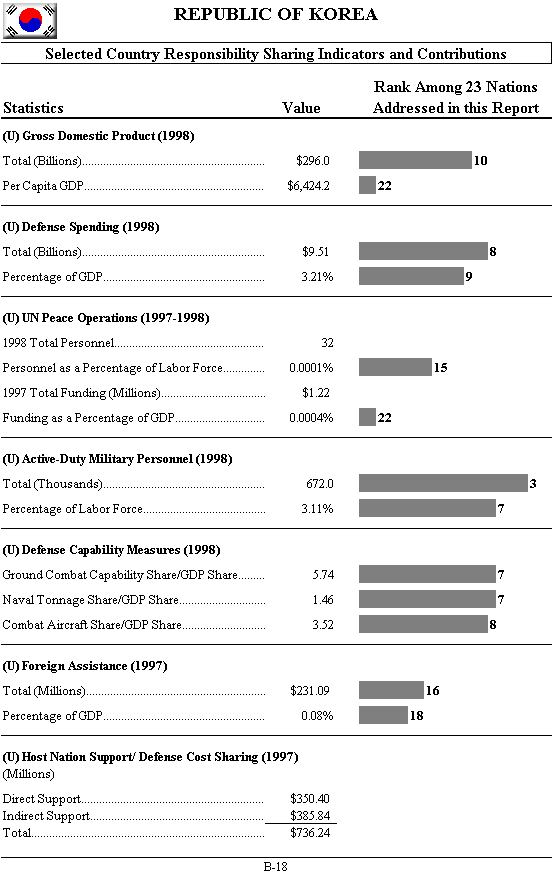
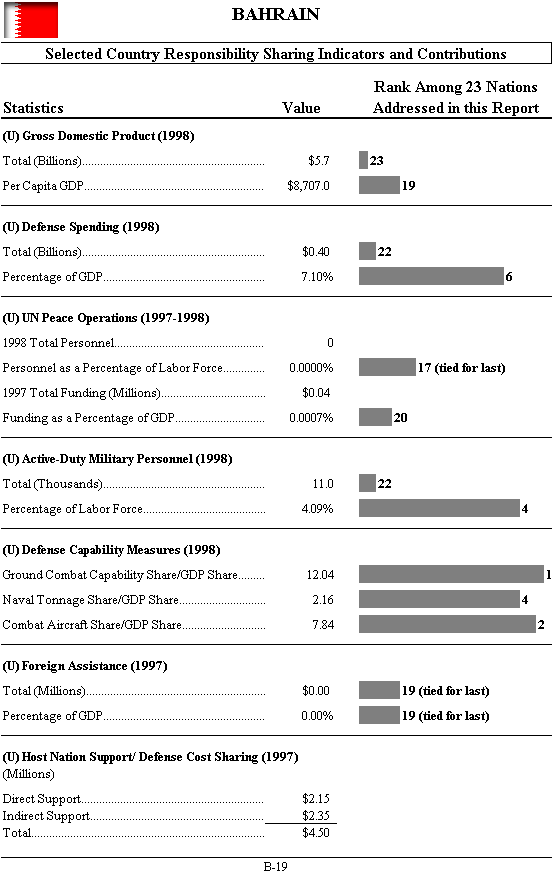
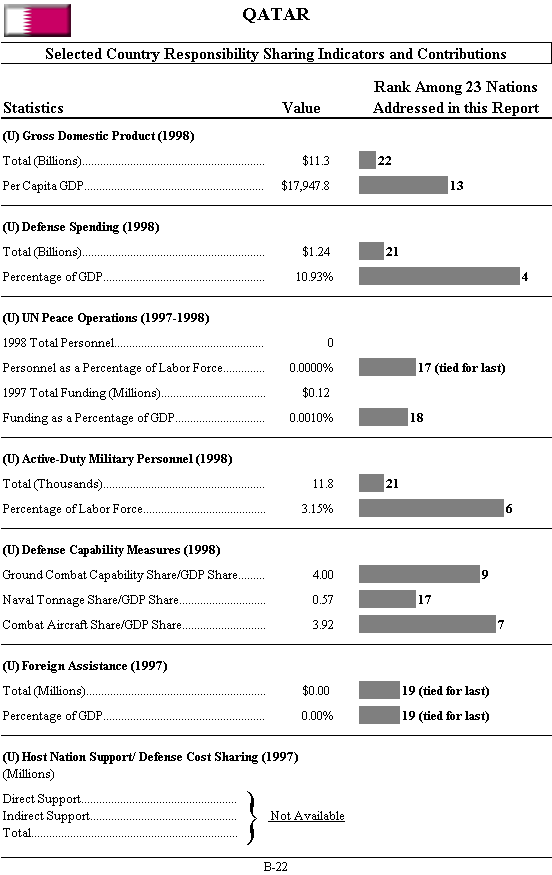
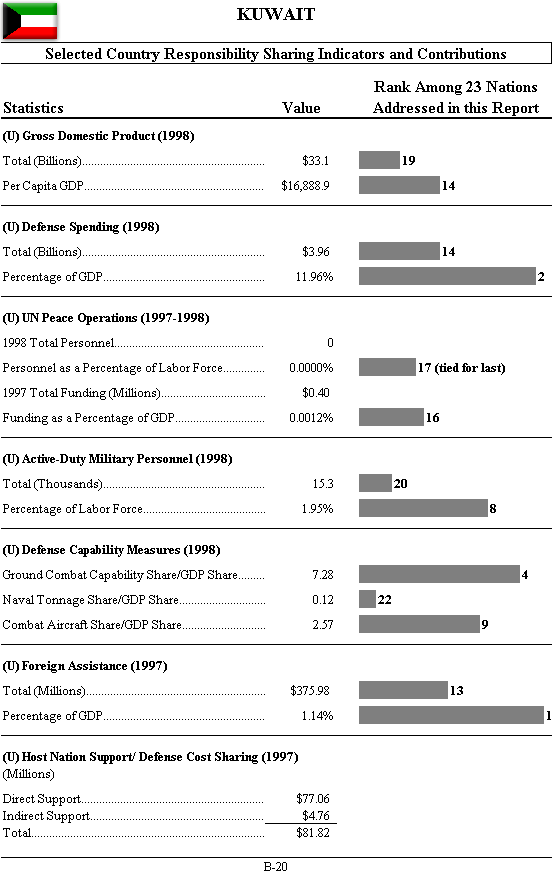
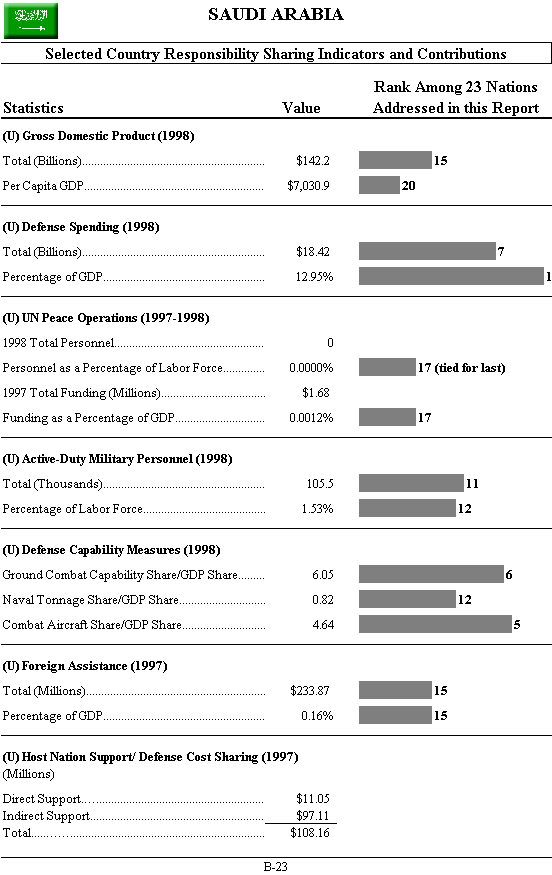
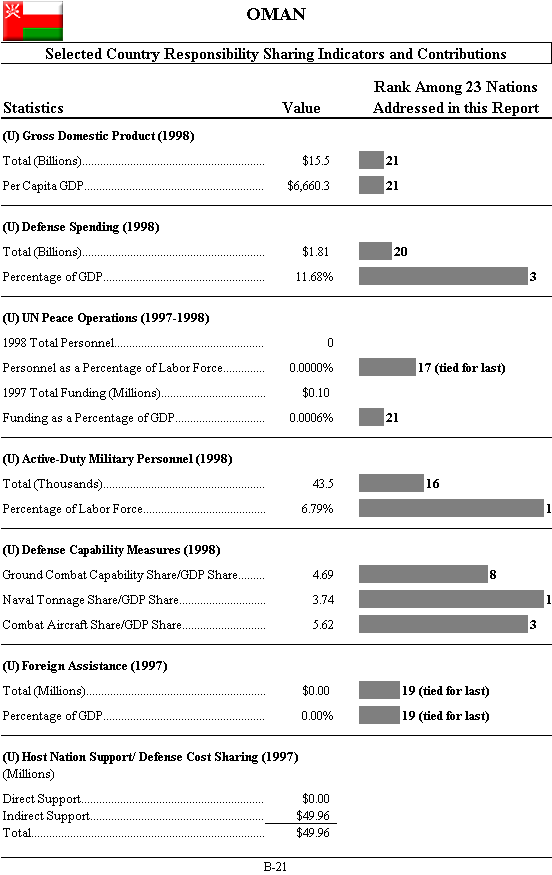
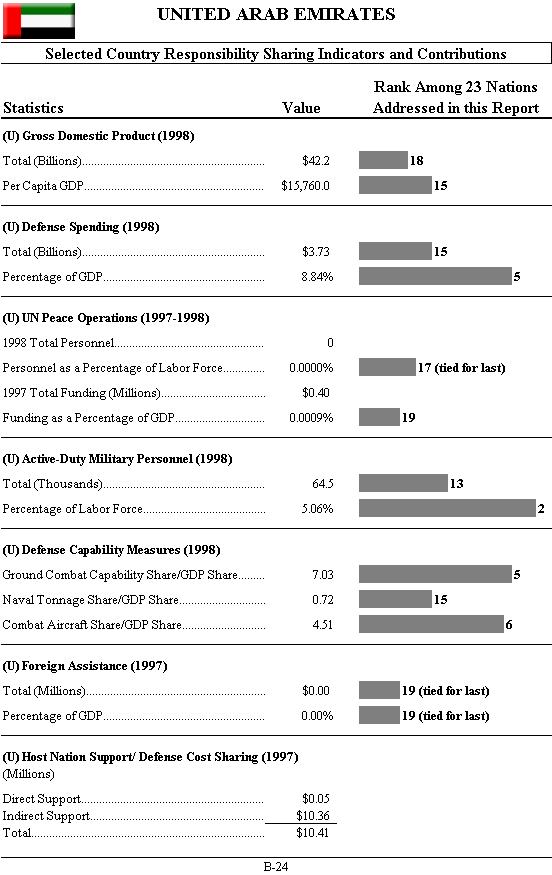
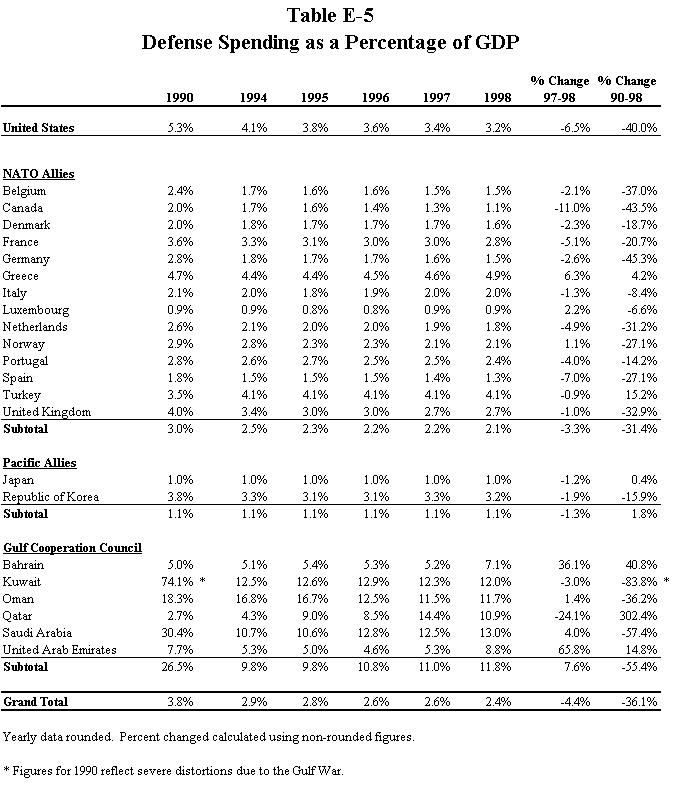
Defense capability measures shown in these tables, reflect a country’s share of total contributions relative to its share of ability to contribute. Thus, a ratio around 1 indicates that a country’s contribution is in balance with its ability to contribute. A ratio above 1 suggests that a country is contributing beyond its“fair share,” while a ratio below 1 means contributions are not commensurate with ability to contribute.
Note: With the exception of cost sharing estimates, all dollar figures shown in the country summary charts are in 1998 dollars, using 1998 exchange rates. Cost sharing figures reflect 1997 contributions, and are calculated using 1997 dollars and exchange rates.
C. Selected Indicators. Data upon which many of the Report’s assessments are based involve a comparison of a country’s contributions relative to its ability to contribute. This section provides the data upon which this analysis is based. The analysis is conducted in three stages:
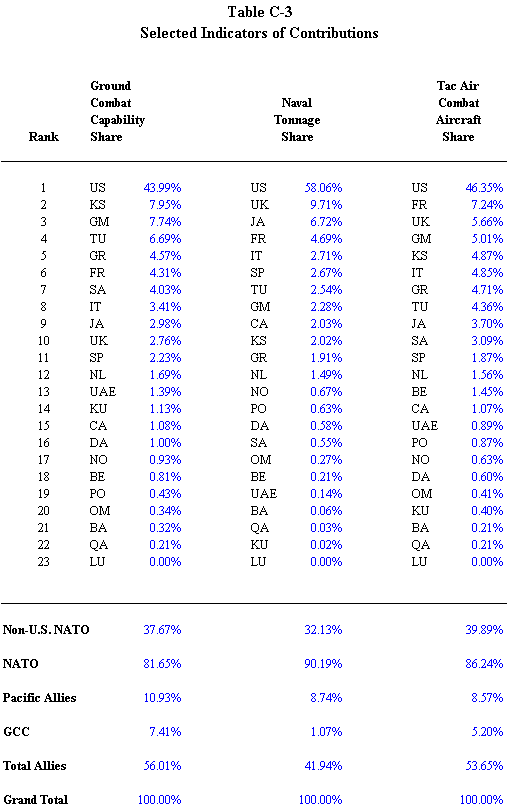
Table C–3 — Selected Indicators of Contributions (Ground Combat Capability Share; Naval Tonnage Share; Tac Air Combat Aircraft Share)
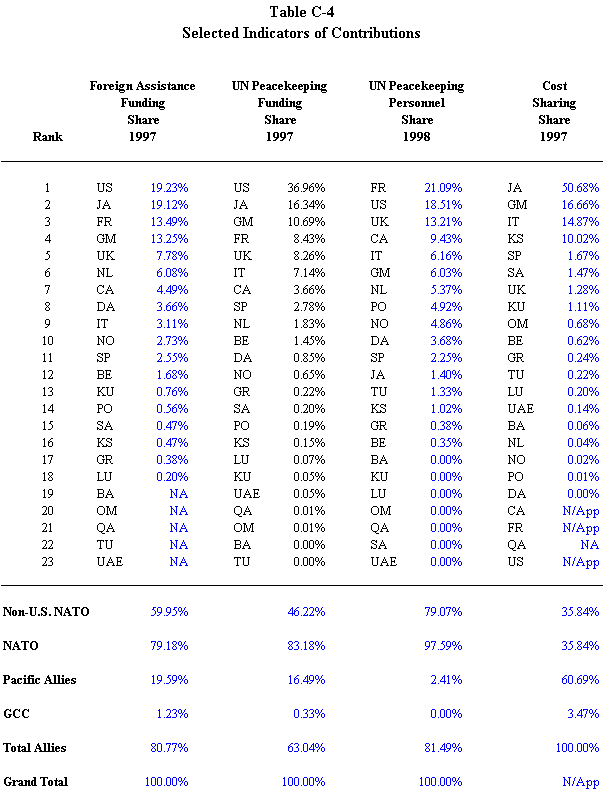
Table C–4 — Selected Indicators of Contributions (Foreign Assistance Funding Share — 1997; UN Peacekeeping Funding Share — 1997; UN Peacekeeping Personnel Share — 1998; Cost Sharing Share — 1997)
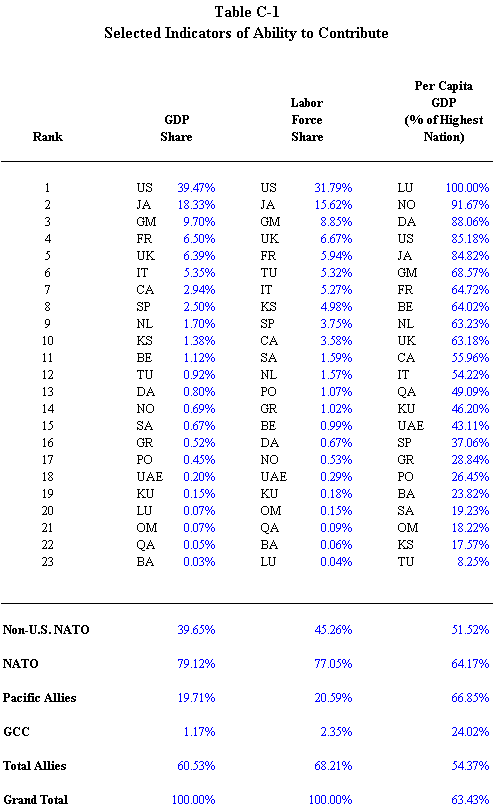
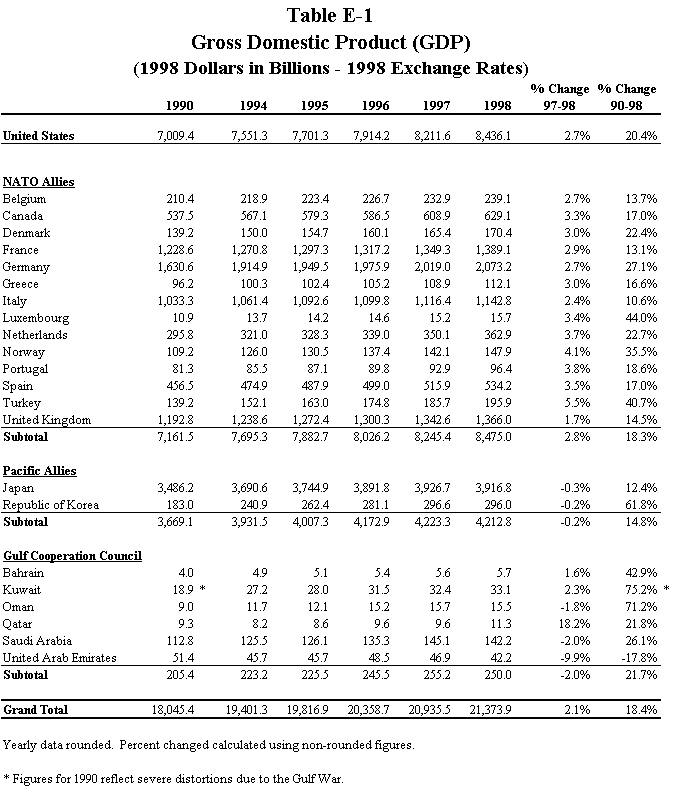
Similarly, a country’s ability to contribute is expressed as a share of the total of all nations in the Report (i.e., share of total GDP, share of total labor force). These data are shown in Table C–1 (Selected Indicators of Ability to Contribute).
By creating a ratio of the share of contribution divided by the share of ability to contribute, analysts can draw conclusions as to the extent and the equity of nations’ efforts. These ratios are provided in Table C–5 through C–7.
Table C–6 — Selected Indicators of Contributions Relative to Ability to Contribute (Ratio Ground Combat Capability 1997 Share/GDP Share; Ratio Naval Tonnage 1998 Share/GDP Share; Ratio Tac Air Combat Aircraft 1998 Share/GDP Share)
Table C–7 — Selected Indicators of Contributions Relative to Ability to Contribute (Foreign Assistance Funding Share — 1997; UN Peacekeeping Funding Share — 1997; UN Peacekeeping Personnel Share — 1998; Cost Sharing Share — 1997)
When this analysis results in a ratio of around 1.0, a country’s contribution is judged to be in balance with its ability to contribute. Generally speaking, the Department gives a nation credit for “substantial contributions” relative to its ability to contribute when it achieves a ratio of 1.2 or greater. Ratios of 0.8 or less indicate very low effort relative to ability to contribute.
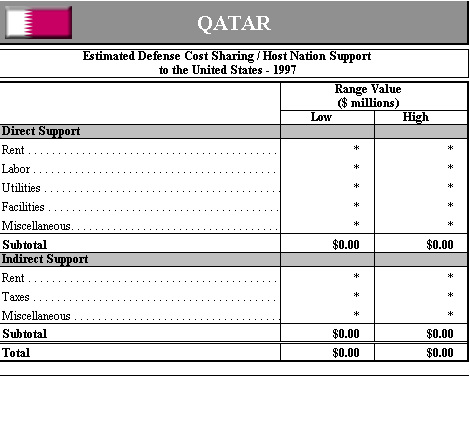
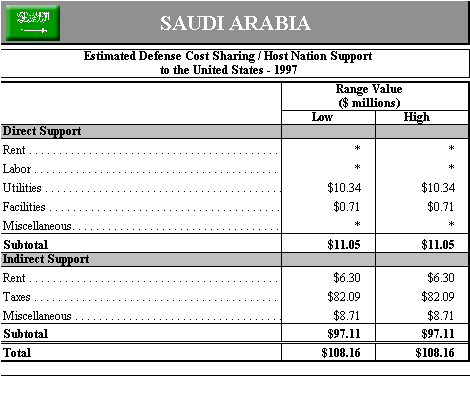
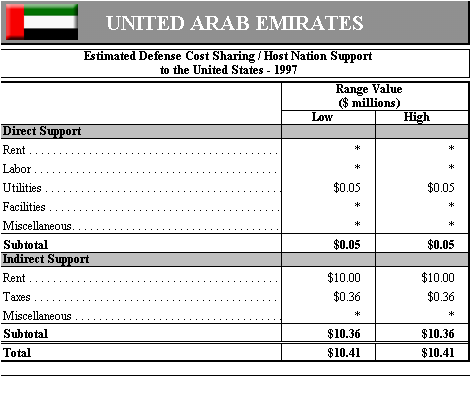
D. Bilateral Cost Sharing. This section presents detailed estimates of nations’ bilateral cost sharing support for the United States during 1997, the most recent year for which complete data are available.
E. Additional Statistics. This section provides data values upon which many of the Selected Indicators are based. Most of the tables in this section also provide information such as subtotals, shares, and ranks. Note: In Tables E–8 through E–10, only shares and ranks can be presented, since actual data values are classified.
The assessments presented in this Report are only as good as the data upon which they are based. The Department has every confidence that the data used for the assessments in this Report are as complete, current, and comprehensive as they can be, given the deadlines established in the legislation.
Timing and Limitations
The FY 1999 Defense Authorization Act stipulates that allies should take certain actions or achieve certain results in various indicators of responsibility sharing by September 30, 1998. Due to unavoidable time lags in the collection and analysis of the necessary data, this Report relies on statistics for 1997 and 1998. Projected data for 1999 are either not available for many key elements necessary to the analysis, or where available, are generally unreliable. The Department is therefore unable to assess countries’ performance against Congressional targets set for 1999, and — due to these time lags in data collection and analysis — will be unable to do so for another one to two years.
The FY 1999 Defense Authorization Act also requires the Department to measure the year–to–year change in nations’ responsibility sharing performance, specifically between February 28, 1998 and February 28, 1999. Because of the timing issues described above, data are simply not yet available as of this writing to permit this specific comparison. Instead, the Department has compiled relevant comparisons for the two most recent years for which complete and reliable data are available.
Data Sources
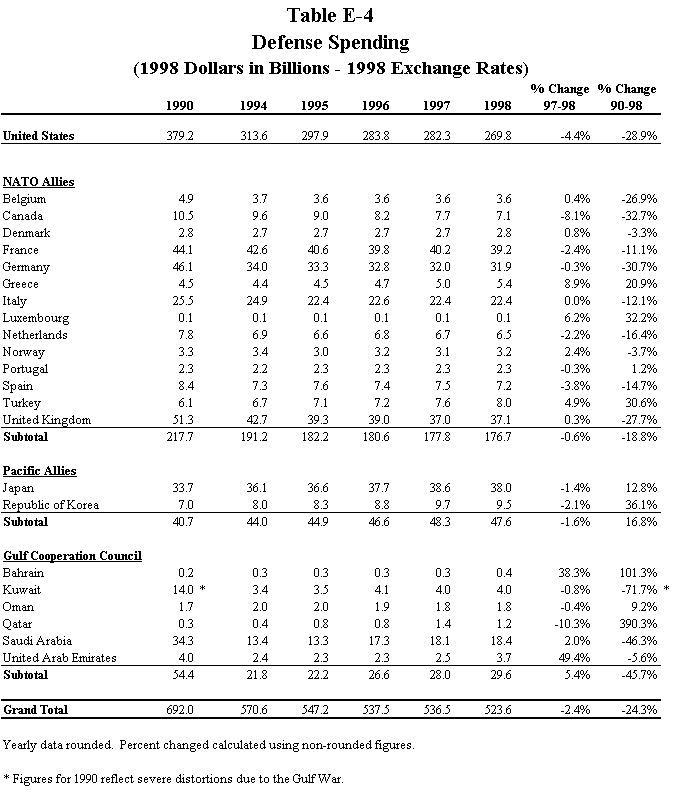
Defense spending data are provided by a variety of sources. NATO”s December 1998 report on Financial and Economic Data Relating to NATO Defense is the primary source for past and current defense spending data for the NATO nations, including the United States. Sources of defense spending data for Japan, the Republic of Korea, and the GCC nations include U.S. embassies in the host nations, recent national defense white papers (where available), and the International Institute for Strategic Studies (IISS).
For purposes of standardization and comparability, this Report presents defense spending figures using the NATO definition of what constitutes defense spending wherever possible. According to this approach, defense expenditures are defined as outlays made by national governments specifically to meet the needs of the armed forces. In this context, the term “national government” limits “defense expenditures” to those of central or federal governments, to the exclusion of state, provincial, local, or municipal authorities. Regardless of when payments are charged against the budget, defense expenditures for any given period include all payments made during that period. In cases where actual 1998 defense outlays are not available, final defense budget figures are substituted. War damage compensation, veterans” pensions, payments out of retirement accounts, and civil defense and stockpiling costs for industrial raw materials or semi–furnished products are not included in this definition of defense spending.
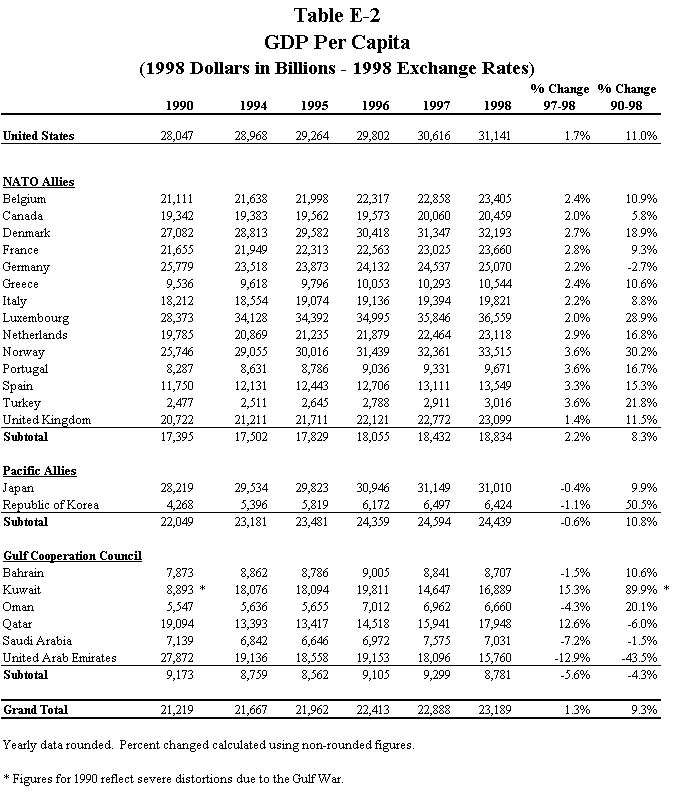
GDP data for NATO members, the Republic of Korea, and Japan are taken from the Organization for Economic Cooperation and Development (OECD). GDP data for the GCC countries (which are not reported by OECD) are drawn from the World Bank and the WEFA Group.
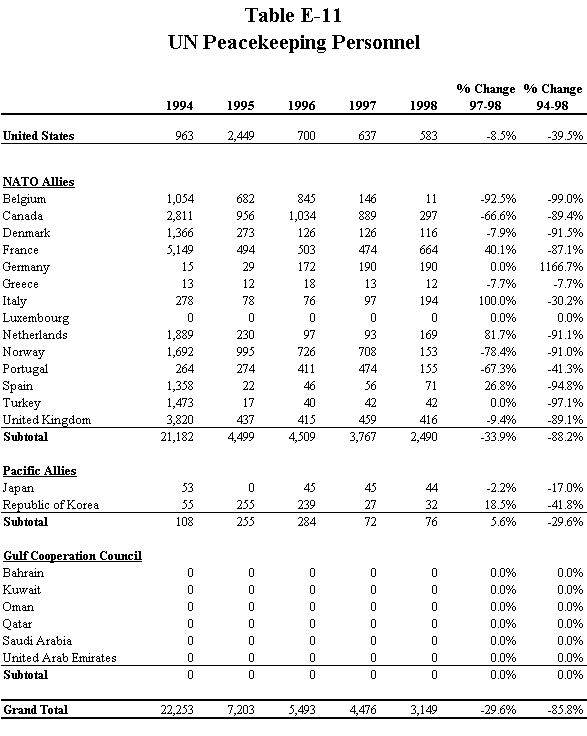
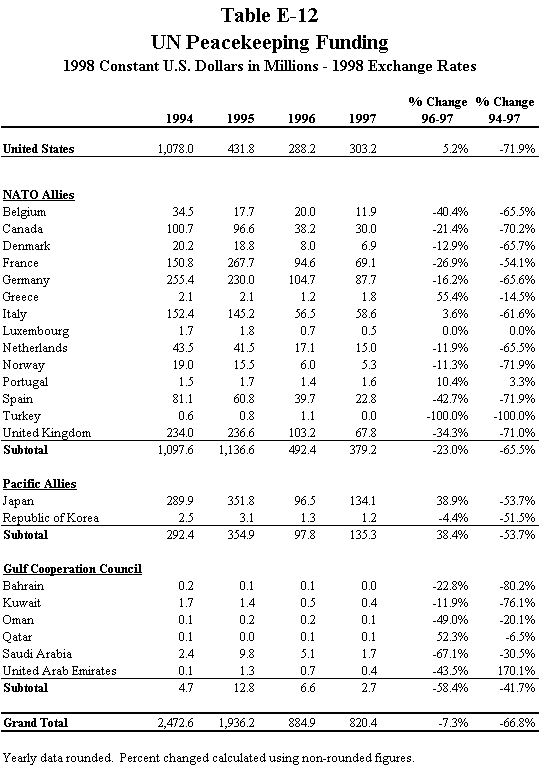
UN peacekeeping data are taken from the latest available UN reports (funding through December1997, personnel as of November 1998).
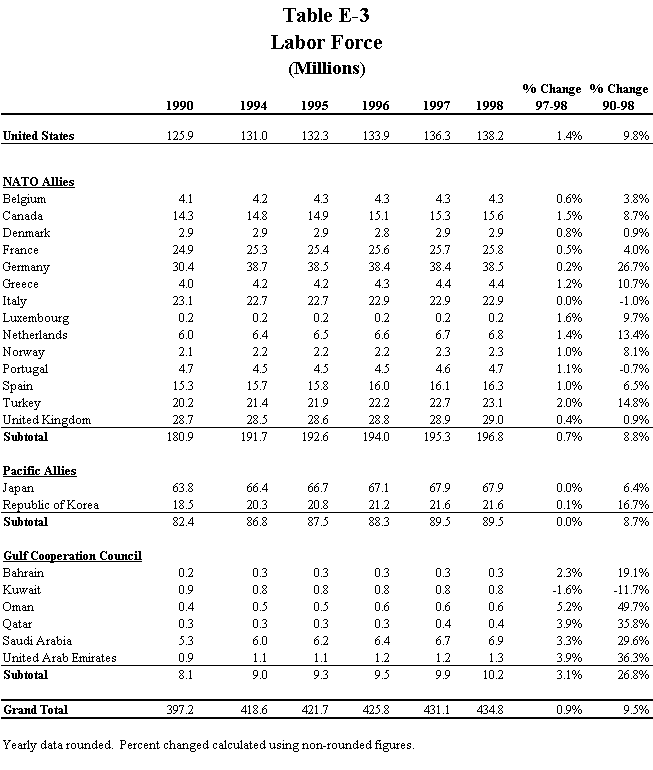
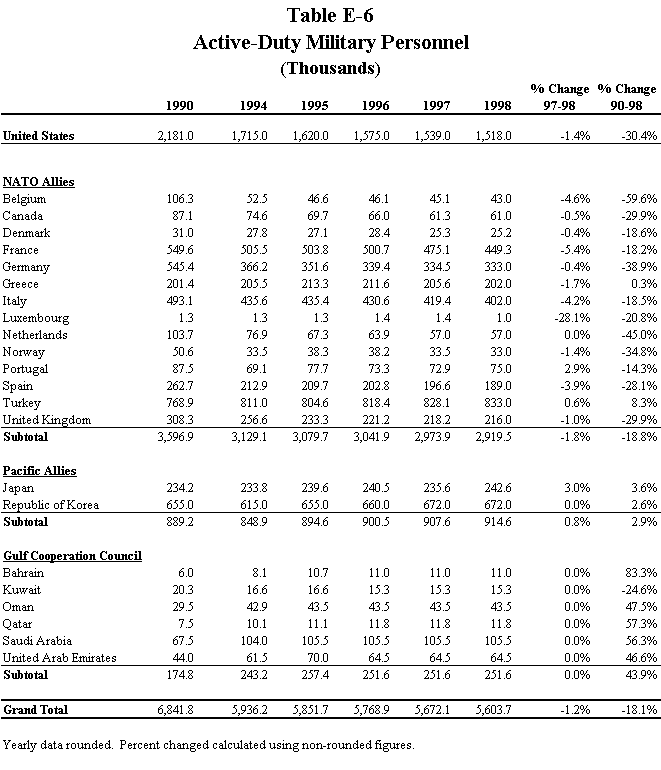
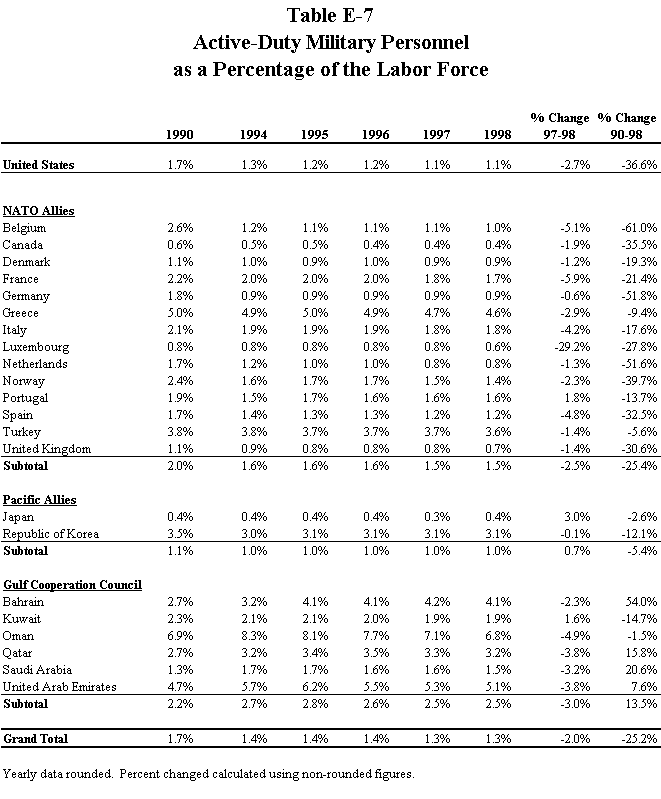
Military personnel data are taken from the Annual NATO Press Release (December 1998) and the International Institute of Strategic Studies.
Military forces data (ground, naval, and air) are drawn from a variety of sources.
In general, forces data are based on information provided by nations under the CFE data exchange (for those forces limited by CFE), supplemented with data from responses to the NATO”s Defense Planning Questionnaire (for those nations that participate in NATO”s integrated defense planning process), open sources (such as Jane”s Defense publications and magazines and the International Institute for Strategic Studies” (IISS) Military Balance for 1998–99), and DoD sources.
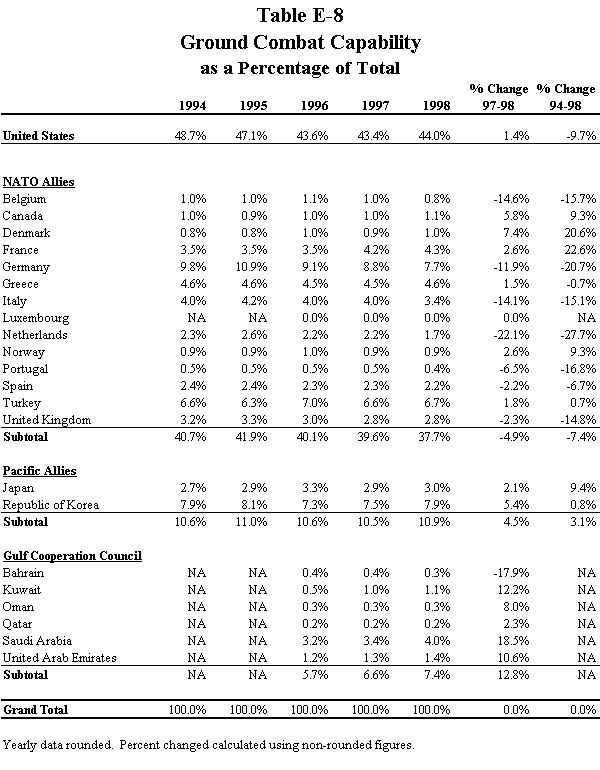
Ground combat capability data assess all major combat systems, including tanks, armored personnel carriers, armored infantry fighting vehicles, artillery, anti–tank weapons, and attack helicopters for army and marine units. Transport, small arms, or combat support assets are not included. The quantity and quality of nations’ equipment holdings are assessed using widely accepted static measures. Estimates are normalized using the score of a U.S. armored brigade in order to express each nation’s static ground force potential in terms of a standardized unit of measure. Comparable time–series data for ground combat capability are available only from 1994.
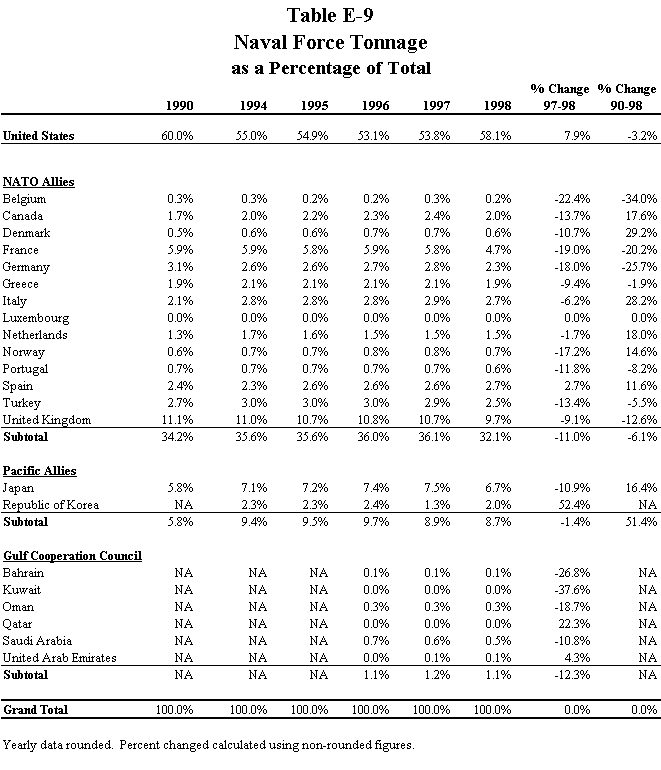
Naval tonnage data includes aircraft carriers, attack submarines (non–strategic), principal surface combatants (cruisers, destroyers, frigates, and corvettes), mine warfare ships and craft (including mine layers), patrol combatant ships, and amphibious warfare ships. Strategic submarines, patrol craft, amphibious craft, or service support craft are not included.
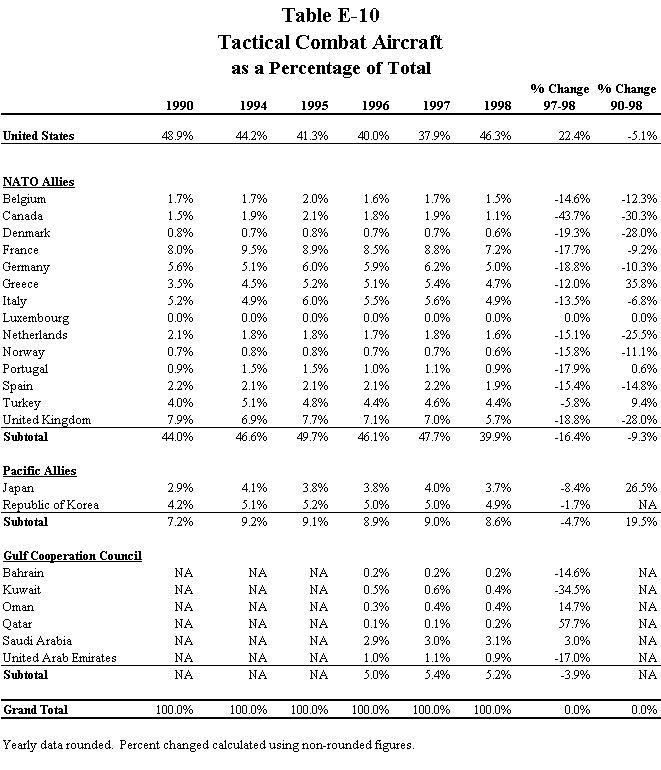
Air forces data includes fixed–wing combat aircraft (air force, naval, and marine assets) in the following categories: fighter/interceptor, fighter/bomber, conventional bomber, and tactical fighter reconnaissance aircraft (including combat capable trainer and electronic warfare aircraft). Not included are maritime patrol aircraft (MPA), anti–submarine warfare (ASW) aircraft, transports or air–to–air refueling aircraft, strategic bombers, or any support or special mission aircraft.
Multinational military activities data assesses a.) national contributions to NATO’s Reaction Forces and other multinational formations, and b.) national forces that are available for prolonged UN, NATO, OSCE and/or WEU peacekeeping operations. Ground forces contributions are quantified in combat maneuver brigade equivalents (excluding organic divisional combat support units), and naval contributions in numbers of principal surface combatants (PSCs). Air forces contributions are measured in terms of combat aircraft when assessing multinational reaction forces, and combat and support aircraft when tallying forces available for peackeeping.
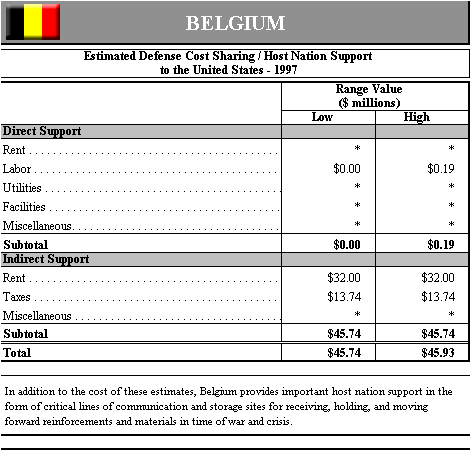
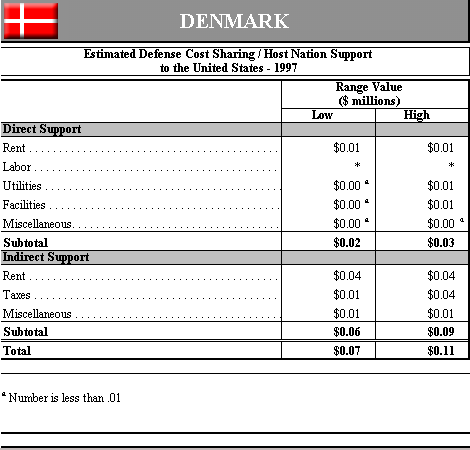
Cost sharing data are provided by U.S. embassies and DoD components, including the military departments and commands. DoD components also provide estimates of U.S. stationing costs by country. Extensive manual calculations are required to determine the estimated value of contributions made by each nation to the United States, and of U.S. expenses incurred overseas. Cost sharing data and stationing cost estimates for a given year are collected by the Department during the spring of the following year, and are then evaluated and published as budget exhibits. Due to the Congressional deadline for this Report, the Department must provide estimates for 1997. Data gaps and the classification of some figures prevent full coverage of cost sharing and stationing cost estimates for all nations covered in this Report. For example, cost offset percentages cannot be calculated for most GCC nations due to lack of information regarding U.S. stationing costs in those countries.
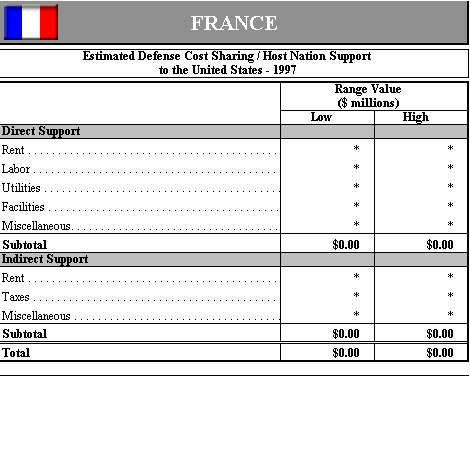
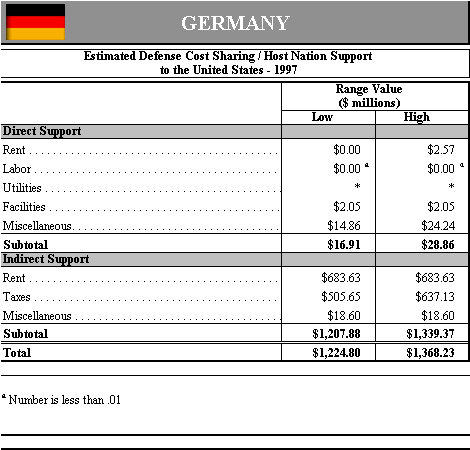
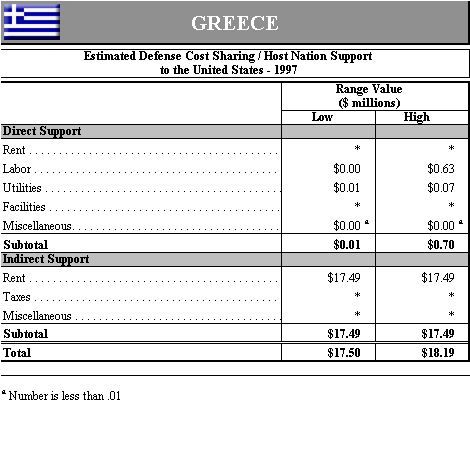
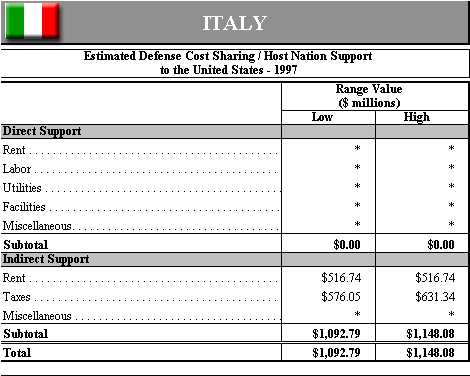
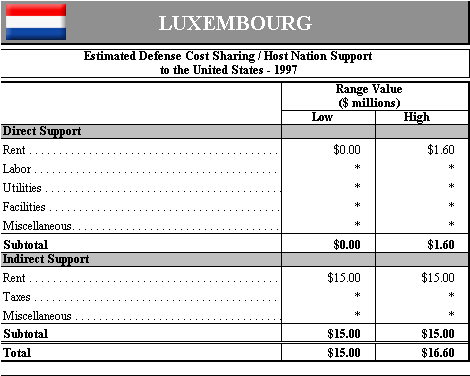
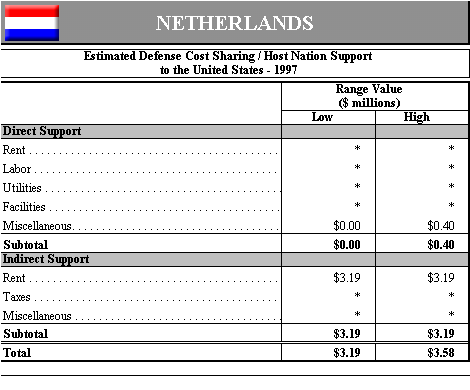
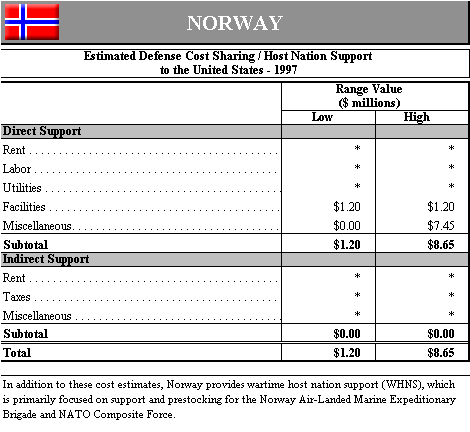
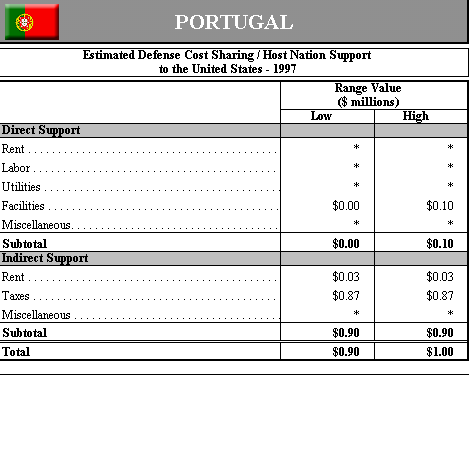
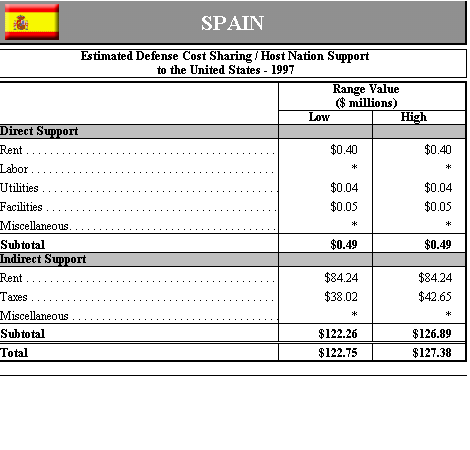
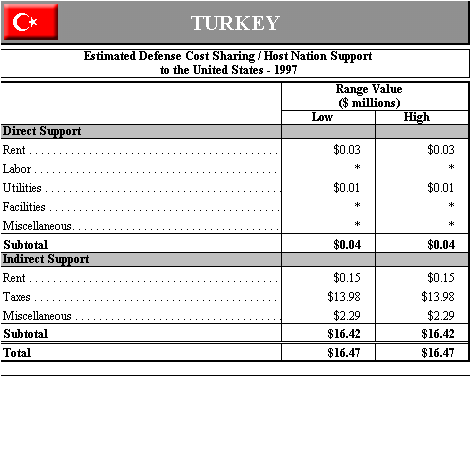
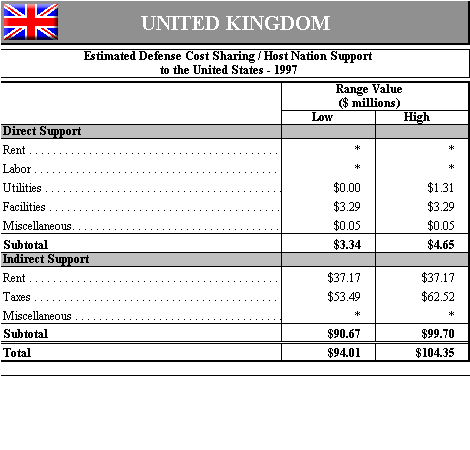
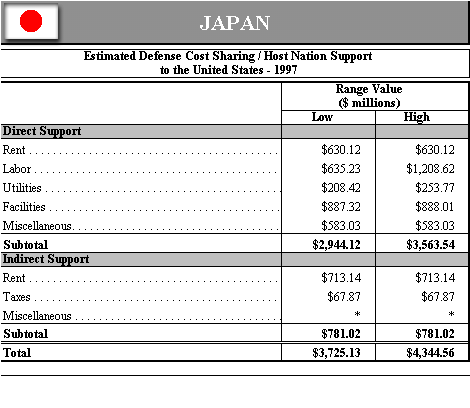
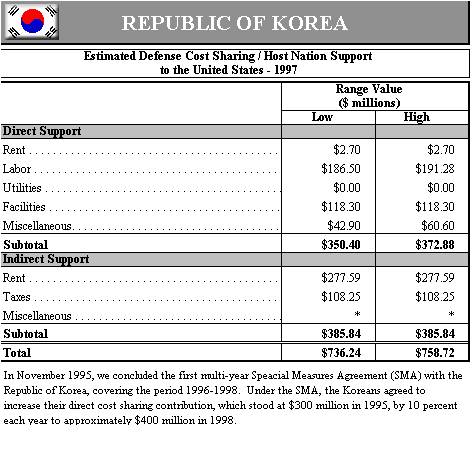
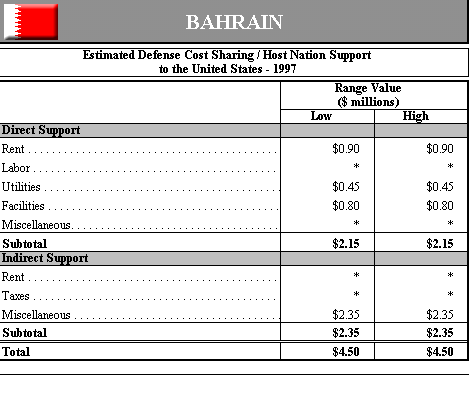
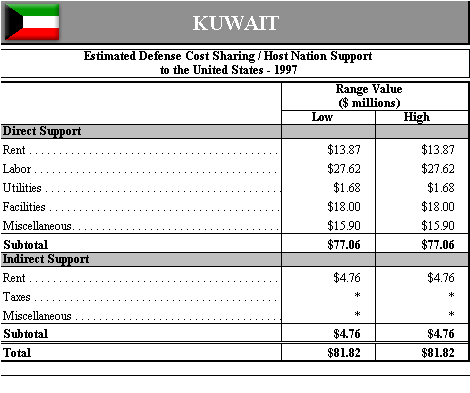
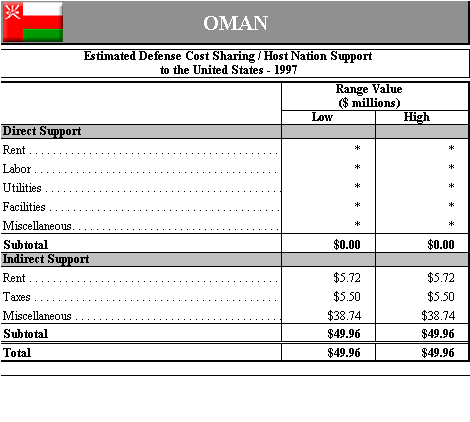
Bilateral cost sharing is divided into two categories, according to whether the costs are borne by the host nation on–budget (direct cost sharing), or only as imputed values of foregone revenues (indirect cost sharing). Direct cost sharing includes costs borne by host nations in support of stationed U.S. forces for rents on privately owned land and facilities, labor, utilities, facilities, and vicinity improvements. Indirect cost sharing includes foregone rents and revenues, including rents on government–owned land and facilities occupied or used by U.S. forces at no or reduced cost to the United States, and tax concessions or customs duties waived by the host nation.
Due to multiple sources for cost sharing data, these estimates are subject to some variation. Generally in this Report, the Department uses the conservative end of the range. In addition, fluctuations in exchange rates over time can cause differences in the estimates. This is particularly noticeable for our Pacific allies, where large shares of cost sharing are conducted in host currency, and where we have recently experienced large variations in exchange rates.
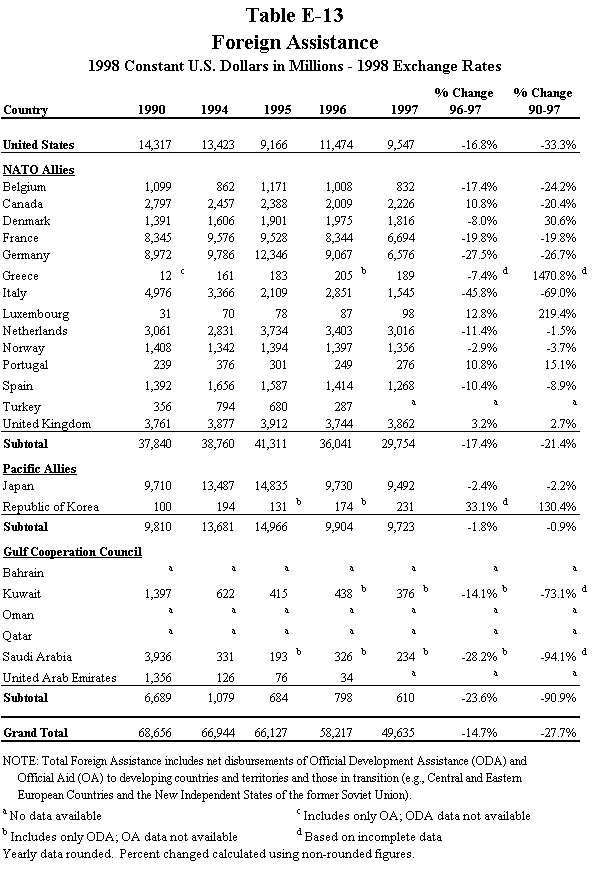
Foreign assistance data are provided by the OECD. The OECD’s Development Assistance Committee (DAC) encourages commitments of international aid, coordinated aid policies, and consistent aid reporting. The DAC’s definition of “official development assistance” (ODA) is recognized as the international standard for reporting aid provided to developing countries and multilateral institutions. This is immensely useful, since “aid” is an extremely broad term, and encompasses many different types of assistance, which can make contributions from various nations very difficult to compare directly.
OECD has a 27–nation membership (G–27), including all NATO countries and Japan. The G–27 establishes economic and political conditions that nations must meet before receiving assistance (e.g., demonstrated commitment to political reform, and free and fair elections). Subsidies are provided in the form of trade and investment credits, grants, and loan guarantees, and are directed into areas such as food aid, medical supplies, and technical assistance in management training, privatization, bank and regulatory reform, environmental projects, market access/trade, nuclear reactor safety, and democratic institution building. The G–27 is also coordinating nuclear safety assistance to the NIS.
Aid to 12 of the 22 emerging economies of Central Europe and the NIS does not qualify as official development assistance for OECD purposes, but instead is categorized as“official aid” (OA). Both categories, ODA and OA, cover identical types of assistance, with the only difference being the recipient nations. Other OA recipient nations include more advanced developing countries (e.g., Israel, Kuwait, Qatar, and the United Arab Emirates). Recipient nations move from one category of aid to the other depending on their development status. In 1997, Moldova switched to became an ODA recipient and Israel, an OA recipient nation. Total foreign assistance evaluated in this Report is the sum of all ODA and OA.
Foreign assistance data in this Report cover the period 1990 through 1997. At this time, complete and reliable foreign assistance data is available only through 1997 due to complexities and delays in the OECD collection and reporting process, and data are still not complete for some countries for 1990, and 1995–1997. No data are available for Turkey or the United Arab Emirates in 1997, nor in any year for Bahrain, Oman, and Qatar.
| Belgium | Netherlands | |
| Canada | Norway | |
| Denmark | Portugal | |
| France | Spain | |
| Germany | Turkey | |
| Greece | United Kingdom | |
| Italy | United States | |
| Luxembourg |
| Japan | Republic of Korea |
| Bahrain | Qatar | |
| Kuwait | Saudi Arabia | |
| Oman | United Arab Emirates |
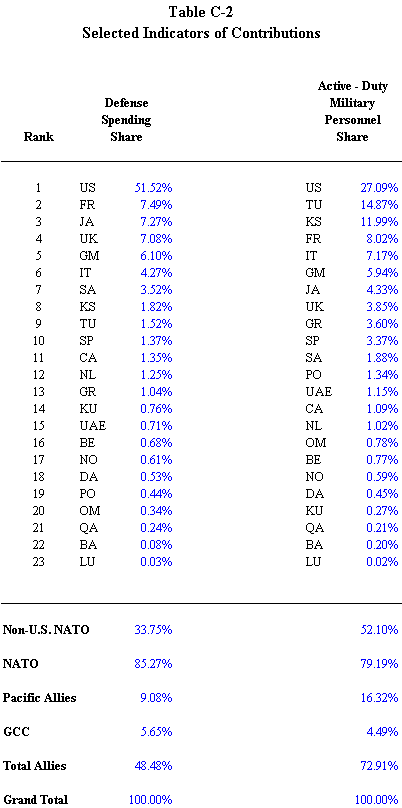
Table C–2. Selected Indicators of Contributions (Defense Spending Share; Active–Duty Military Personnel Share)
Table C–3. Selected Indicators of Contributions (Ground Combat Capability Share; Naval Tonnage Share; Tac Air Combat Aircraft Share)
Table C–4. Selected Indicators of Contributions (Foreign Assistance Funding Share — 1997; UN Peacekeeping Funding Share — 1997; UN Peacekeeping Personnel Share — 1998; Cost Sharing Share — 1997)
Table C–5. Selected Indicators of Contributions Relative to Ability to Contribute (Ratio Defense Spending 1998 Share/GDP Share; Ratio Active–Duty Military Personnel 1998 Share/Labor Force Share)
Table C–6. Selected Indicators of Contributions Relative to Ability to Contribute (Ratio Ground Combat Capability 1997 Share/GDP Share; Ratio Naval Tonnage 1998 Share/GDP Share; Ratio Tac Air Combat Aircraft 1998 Share/GDP Share)
Table C–7. Selected Indicators of Contributions Relative to Ability to Contributes (Foreign Assistance Funding Share — 1997; UN Peacekeeping Funding Share — 1997; UN Peacekeeping Personnel Share — 1998; Cost Sharing Share — 1997)
| NATO Allies | ||||
|
Belgium |
Canada |
Denmark |
France |
Germany |
|
Greece |
Italy |
Luxembourg |
Netherlands |
Norway |
|
Portugal |
Spain |
Turkey |
United Kingdom |
|
| Pacific Allies | ||||
|
Japan |
Republic of Korea |
|||
| Gulf Cooperation Council | ||||
|
Bahrain |
Kuwait |
Oman |
Qatar |
Saudi Arabia |
|
United Arab Emirates |
||||